ITWorld: What is the value of a data dashboard?

When it comes to convincing your boss of the value of a data dashboard, nothing works better than when you can save some dollars as a result of a trend that you visualized. This is what one of the data-driven marketing staff did for the Texas Rangers baseball team; their dashboard saved about $45,000 in annual costs.


The Rangers are big fans of data dashboards, and they should be: dashboards can spot trends, communicate a particular position to management, or call out trouble spots while you can still doing something about it. I heard from Sarah Stone, who is the marketing and advertising manager for the team and also a Big Data junkie.


Stone gave a talk at the annual Tableau Software user conference held earlier this month near their Seattle headquarters; I also met with her separately to get more information about her situation. She told me that she was new to the team’s front office (as they call the folks who don’t actually get into uniforms) and was looking to support one of her colleagues who were involved in a discussion with one of their long-time contractors. Their contract was up for renewal and thanks to Stone’s help they were able to produce a visualization that was used to shave off $45k from the contract. This was a great example of how data science could be used to benefit other marketing and sales efforts.


Tableau Software is big into dashboards and I came across many of them during their conference. One issue is that they can easily overpower management, who may be used to squinting at a series of spreadsheet figures. “The first time you show your boss a visualization can almost be a magical moment, it can really reveal things in your data that weren’t very obvious before,” said a data analyst at a Defense Department contractor I met at the conference. At another session, Vaidy Krishnan, an analyst from General Electric’s Measurement and Control group said, “Dashboards are just a starting point for a discussion. You can’t get everything right out of the gate but using them helps you ask critical questions.”


Stone is the person who has to decide on television and other media advertising buys for the baseball team and has to spend wisely: she needs to know which games are selling slowly, or what kind of ticket buyers are likely to come to which games. To do this, she uses Tableau Software’s tools and connects to several public and private data sources to produce her visualizations.


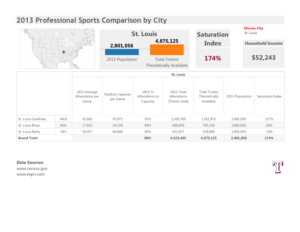
For example, she wanted to see whether the Dallas market was saturated with professional sports teams and used census data to compare the raw number of seats for each metropolitan market. Not surprisingly, St. Louis (as shown below) showed lots of rabid sports fans (something that I can attest to, after living there for several years) while Dallas still had room to grow.


Another analysis looked at how they could save money on their corporate cell phone bills. She was able to find several staffers who were frequently on scouting trips out of the country, and try to adjust their plan to handle more international minute usage. “We also saw a spike in the bills during August but then figured out that was when the whole team was in Toronto for a series of games, so it made sense.”


Her work on tracking ticket sales is an example of how a typical Big Data analysis session goes. Often, you don’t know what questions to ask or how to go about collecting the data that you’ll need for your analysis. At the conference, Neil deGrasse Tyson, the director of the Hayden Planetarium in New York, gave one of the keynotes where said the “really difficult thing was formulating questions that we are currently too stupid to ask now, let alone understand the answers to.” He gave as an example if someone from the 1700s were to try to figure out when the next asteroid would hit the Earth. No one from that era would have even asked such a question.


Stone admits that she often will run several queries and create several different data dashboards before she figures out what she is trying to accomplish. This is very typical behavior in the Big Data world. She is in the process of putting together an interactive seating chart of their stadium, showing characteristics of which seats were purchased by season ticket holders, what concession sales happened on particular games, and whether promotions or team performance helps to fill seats.


Not surprisingly, all those bobble-head doll giveaways do drive ticket sales. “And a post-season win translates into three seasons of subsequent increased sales,” she told me. Some of the data is downloaded from StubHub, the secondary ticketing retailer that Major League Baseball helped start. She is also working with the local Southern Methodist University business school students as interns to help integrate regression models based on R.


“Our sales department knows what they are doing when it comes to selling tickets, but when it comes to looking more globally at this process and how it coincidences with other variables such as team performance or the weather, they need help.”  For example, her analysis can predict attendance so the team can better staff the stadium for more crowded games.


Before she started, the marketing department had to make frequent requests for reports from the box office, and these reports didn’t reflect real time sales either. “Producing real-time, holistic visualizations is the holy grail. We’ve always been able to obtain real time data, but it hasn’t been all that accessible and only a few people could gather that information,” she told me. “Our seat inventory is very perishable, and if I can design a discount program or arrange for an ad media buy for the next day’s game, it can have a big impact. Having a stale report doesn’t really help if you are trying to move thousands of tickets. We need to know how sales are trending because once the game is over, we can’t sell those tickets anymore.”

Ironically, when she started with the Rangers last year, Stone knew virtually nothing about baseball—she jokes that she didn’t even know the difference between an out and a hit then. (Now her game knowledge has improved to the point where she accurately scores each game she watches.) She came to the Rangers from another competitive landscape: professional politics, where she used data analytics to help focus media buys and to track what the other candidates were doing. “Really, politics and baseball are very similar,” she told me. “Both marketing groups have no control over the quality of the product you are promoting and you still have to get people to either come out to vote or to go to the game. Data is still data.”
#Strangeloop: How sexist are rap lyrics?

jayI went to a computer conference to learn about how sexist rap lyrics are. What makes this all the more remarkable is that the session was given by a woman, Julie Lavoie here in St. Louis at the annual Strangeloop programming conference.

Actually, it kinda makes sense: the idea is to parse the entire corpus of lyrics (there is a site called rapgenius that has compiled this information for hundreds of songs) and do some natural language processing to see what is being said. It was very entertaining, even though I know almost nothing about rap music. (That is Jay Z above, BTW.)

As you can probably guess, the most common words mentioned in rap songs are cuss words, and other epithets that I hesitate to use here and run up my spam scores. But Lavoie started with an interesting hypothesis: what if she searched for a particular word that rhymes with witch and is used as a common term for women. Do the rappers who have a sexist rep use it more often in their songs? How about men vs. women rappers? What about rappers from different geographies or styles of music? (Yes, that was something I never knew.)

Well, she found out that things weren’t so simple: lots of rappers use this particular epithet, and many have far worse things to say about women that are hard for a Python script to process automatically. Do you look for the association of particular action verbs with particular nouns? The mind boggles.

Lavoie at one point had to temporarily stop her analysis, because it was getting her depressed seeing the negative words that were bubbling up to the top of most often used list. But she is a trooper (and also a big fan of rap music, which is why she started the project to begin with). The project got her thinking more about how to characterize sexist lyrics and gave her fuel for further explorations. Granted, she could have chosen French literature or modern poetry, but she likes rap so that is where she focused her efforts.

This is just the sort of thing that you can find at Strangeloop: interesting tech stuff, presented by people that you probably never heard of mixed with the leading lights of major programming languages and open source projects. If the show isn’t on your fall calendar, it should be. Plus, you can come visit me in St. Louis too!

Holding office hours for your end users

I was at the Tableau Software annual user conference in Seattle this week, and one takeaway was an idea that I heard from one of the presenters about holding “office hours” to support your end users. It is an old idea that may be worth revisiting.

Back when I toiled in the IT end user computing fields for Megalith Insurance, we had several staff for our own phone-based hotline to support the insurance agents around the country. That was great for them, because we couldn’t really make house calls. But we had several thousand users in our three office towers in downtown Los Angeles that were only an elevator ride away. These folks had to call us when they were in need or distress and wait for us to get to their offices. We never really thought about holding office hours where the users could drop in, frankly because we didn’t want them to know where we worked. Maybe there was some other reason, I was never quite sure. It was probably because back then we had mainframe programmers in abundance, and no one ever ventured into their holy of holies offices either.

But that was then. Today we all work in bullpens and people bring their bikes and dogs into work. And there are a lot of end-user oriented tools besides spreadsheets and word processors.

And when it comes to a visualization tool such as Tableau, seeing is literally believing. Having a steady hand and someone who knows their way around the interface can make a big difference in speeding up the learning curve for a newbie.

mod2At the Tableau conference, I spoke to Krystal St. Julien, a data analyst with eCommerce retailer ModCloth.com. She comes from a academic biomedical research background, which is why she calls what she offers “office hours.” Only instead of students waiting outside her office door, she schedules her time with Google Calendar. It is working well for her, not just on an efficiency level but on a user empowerment level too. She helps her users over learning speed bumps and gets an entire team up and running with Tableau in record time. (An interesting side note: all of her data analysis department are mostly women, with the exception of the boss. Some lesson to be learned there, too.)

Maybe it is time we bring back this concept into wider use. Who knows, it could help some IT shops over their image problems.


Gigaom webinar: Customer-Driven Infrastructure: Building Future-Ready Consumer Applications

Based on a white paper that I wrote earlier in the year for them, I am holding a webinar next week with the above focus. In this webinar David S. Linthicum SVP, Cloud Technology Partners and Brandon Elliott the Chief Technologist for Rackspace and I will examine the infrastructure needs of customer-facing applications by examining the challenges faced by businesses in the most demanding industries. It will provide a framework for evaluating technology decisions from the perspective of customer experience quality and suggest metrics that can help businesses justify and benchmark the success of their investments.

You can register here for the event, to be held on August 28th.


ITworld: Data artist in residence: Why your data needs an artist’s touch

jerAs more companies hire data scientists, there is a corresponding trend to hire a new kind of employee that some refer to as “data artists,” whose job it is to tell the stories behind the data in the most accessible and revealing ways. And these folks are taking major roles on product management teams, such as Jer Thorp pictured here. In this story for ITWorld today, I talk about what is a data artist and how Microsoft and Google and the New York Times are making good use of them.

The new open compute servers are here

bad_neighboursThe PC server market has been a fairly boring one for the past several decades. Sure, they contained things like specialized Xeon CPUs and lots of memory modules and could attach to big storage arrays. But the for most part, buying a server meant having just something bigger than you had on your desktop. Those days are about to change with the new servers available from Rackspace and the Open Compute Project.

To show you that this is far from a new idea, do you remember the Tricord? I am not talking about the thing carried around on Star Trek. Instead, this was a server unit made in the middle 1990s. It came with eight CPUs, could hold 3 GB of RAM and nine half-height drives, along with lots of redundant power supplies, controller boards and other high-end features. All this went for $70,000. That’s right, they weren’t cheap either.

Nowadays the notion of a 3 GB PC is what you would find as a minimum desktop configuration to run Windows, and most servers have hundreds of GB of RAM installed. But again, the design of a PC server hasn’t really seen much change. Until now.

Facebook started the Open Compute project several years ago, in the hopes that they could encourage some innovation for the kinds of hardware that they were building for their own data centers. These customized servers were stripped down models that were designed to run in the cloud, not on your desktop or even in your own data center.

The project saw some major milestones this week with several announcements at the Gigaom structure show. There is an opportunity for anyone to have their own cloud-oriented server, as announced from Rackspace this week at the event.

Why is this important? It represents a big moment for servers, taking steps to finally move beyond the original PC architecture that began in the early 1980s. It is a way for Rackspace to offer an entire server that previously was only available as a compute or storage instance for cloud customers. It is also a way to get around the “bad neighbor” problem that faces many cloud apps, where another greedy server instance can hog server resources and make life miserable for your own app.

The servers are from Quanta and called OnMetal and come in three different version that are focused on CPU, storage or RAM. If you have to build an Internet service that is going to need a lot of firepower, you might want to take a closer look.

Random acts of pizza turns out to be not so random

requestI know this past weekend is more associated with barbeque than pizza, but I came across an interesting study of pizza that I thought I would whet your appetite this morning. For those of those you have spent time on the site Reddit, you know one of their communities is called “Random Acts of Pizza” or RAOP. On the site, people can submit requests for free pizza and if their story is compelling enough a fellow user might decide to send them one. Why not? Who doesn’t like a free pizza?

Users can only ask for pizza, and only one user can supply the pizza. For example, a request might go something like this: “It’s been a long time since my mother and I have had proper food. I’ve been struggling to find any kind of work so I can supplement my mom’s social security. A real pizza would certainly lift our spirits.” Anybody can then fulfill the order, which is then marked on the site, often with notes of thanks.

It is an interesting community. Because of the way it is structured, a group of data and social scientists used RAOP as the basis for a study that looked more closely at altruism, or what motivates people to give when they do not receive anything tangible in return. Tim Althoff of Stanford University and others wrote the paper published earlier this year in a research journal.

The researchers were able to download the many thousands of requests and eventually analyzed more than 5000 of them where they could track a response, whether it was successful or not, and other variables that they were able to quantify. From the data, they parsed this information and then built a mathematical model that would be used as a predictor of the success of the individual posts.

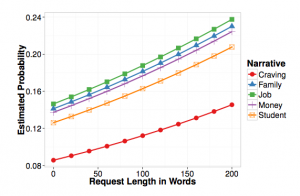
They found that it helps to ask for pizza earlier in the month, make your request post longer (see the graph above), include an image documenting your request (a copy of a job termination letter or an empty fridge), and show that your request should state that are willing to give back to the RAOP community. This last item bears some further explanation. Most of us would probably be cynical and say, yeah, sure, these folks are trying to game the system and get a free pizza. But the researchers showed that nearly 10% of those that were claiming to pay it forward actually did, which is a pretty high percentage given that many people probably haven’t had an opportunity to reciprocate.

You can also see from the graph above that those stories about jobs, money, or family situations were also more likely to result in pizza deliveries. One item they didn’t find to improve deliveries was that it wasn’t true how the mood of the author was expressed, something that traditional social science research has found in the past.

The next supercomputer may be your cellphone

What if you could have access to a cheap supercomputer in the cloud, and one that automatically upgrades itself every couple of years? One that taps into existing unused processing power that doesn’t require a new ginormous datacenter to be constructed? This is the idea behind Devin Elliot’s startup called Unoceros.com.

I was skeptical when I first heard him talking about it. This is because he borrows processing time on millions of cellphones at night. Think this through for a moment: these phones are charging, often connected to your home Wifi network, and they are sitting completely idle next to your bed. Why not put them to a good purpose? Think of SETI@Home only instead of searching for intelligent life in space, it is being used for running intelligent apps here on planet Earth.

I mean, the puny cellphone? Can’t we find a better collection of processors? Turns out that while we were sleeping, all that CPU power can add up to quite a few petaflops of processing. If you have a couple million cellphones, you can construct a distributed supercomputer that can rival some of those that are on the top500.org list. Today’s modern phone has the processing equivalent of a medium Amazon Web Services instance. That is far from puny.

I have been fascinated with this topic for some time ever since I participated in a rather unique “flash mob” computing experiment about ten years ago in San Francisco. This was the idea behind a course offered at University of San Francisco and taught by scientist Pat Miller, who works full-time at the Lawrence Livermore Labs. Call it Bring Your Own Laptop. One of the participants was Gordon Bell, who was the father of the VAX while he worked at DEC and now at Microsoft. I was one of hundreds of volunteers and left two laptops of my own for the weekend while the class tried to knit them all together to run the usual benchmarks to prove we had created a supercomputer.

While this flash mob failed at assembling a top supercomputer, they were able to get several hundred machines to work together. But that was ten years ago. Now we have the cloud and efforts like CycleComputing,com to build more powerful distributed processors.

Anyway, back to Unoceros. They have developed some software that can be included inside a regular cellphone app that, with your permission, makes use of your idle time to become a distributed compute engine for those developers that are looking for spare cycles. They are working out the kinks now, figuring out how to distribute the load and make sure that bad actors don’t harness their network for evil purposes.There is also the not-so-small issue about who pays whom and how that aren’t trivial either.

Could it work? Perhaps. It isn’t as crazy as having hundreds of people carrying their gear into a university gym one weekend.

SoftwareAdvice.com: 4 Ways Retailers Increase Sales With Mobile-Enabled Foot Traffic Analytics


Attendees of this year’s Super Bowl had the opportunity to stroll down Broadway in midtown Manhattan before the big game and receive personalized, location-specific shopping alerts. These alerts are made possible by mobile-enabled foot traffic technology, which retailers around the country are increasingly using as a way to better understand customer behavior and boost sales.Retailers use this technology to determine peak traffic behaviors, conversion rates and dwell times in the stores. You can read the article here on SoftwareAdvice about ways to increase foot traffic.

And here are a few of the many technologies that are available in this space.

Indoor Tracking Technologies Vendors

 Vendor URL Notable Features
Aisle Labs aislelabs.com Shopper demographics
Aisle411 aisle411.com User navigate store maps
Brickstream brickstream.com 3D Tracking
Euclid Analytics euclidanalytics.com Rich APIs
Gozio gozio.me User navigate store maps
Iinside Iinside.com Precise locations on existing Wifi hardware
inMarket CheckPoints Inmarket.com Pay-for-performance apps
Measurence measurence.com Analytic tools
Mexia Interactive mexia.ca Precise locations on their hardware
Navizon navizon.com REST API access
NEON trxsystems.com Underground support
Qualcomm Gimbal Gimbal.com Personal content delivery
Radius Networks radiusNetworks.com Apple iBeacon support
Retail Next retailnext.com Wide software tools including POS integration
Shopper Trak shoppertrak.com Managed SaaS service
Solomo Technology solomotechnology.com Real-time map display
Store Analytics storeanalytics.de Analytics, tracking & targeting
Swarm swarm-mobile.com POS integration
Turnstyle Solutions getturnstyle.com Push and SMS messaging
Walkbase walkbase.com A/B testing
YFind ruckuswireless.com Precise locations and Wifi integration


Ricoh blog: How Big Data is Changing the Way We Hire

The days where even social networking sites such as LinkedIn and Dice could be things of the past, thanks to the use of Big Data techniques and analysis. It used to be you were only as good as your networks, but today the saying might be you are only as good as your code, or other footprints that can be discovered through various online analytics.

Forbes earlier this year identified this trend where recruiters can plumb databases to see whether candidates are stuck in the same position for too long or those who are quickly rising to new heights. Indeed, there are analysis firms such as Gild.com, RemarkableHire, Entelo and Talentbin.com that can search through open source projects to find the best developers for major tech companies such as Rackspace, Amazon and Expedia. The New York Times also wrote about Gild earlier this year and described their techniques: whereby one firm recruited and eventually hired a programmer who is still working there today. And this is someone that they would have never found otherwise, and who had no idea of the firm’s existence before they contacted him. These analysis firms can also be used to identify how well a potential recruit could perform in their new job, like the way the SAT test can help predict college performance.

But there are other less obvious methods. Through various Big Data contest sites, posters can claim fame and at least modest fortunes from winning programming challenges. The most notable of these is Kaggle.com, which has run hundreds of contests and awarded thousands in prices. Recruiters often go after these successful entrants.

Security vendor Impermium sponsored a programming contest on Kaggle a few years agoThe prize was $10,000, along with an opportunity to interview for a job at the company. While Impermium ultimately did not hire anyone, “the Kaggle competition was useful and we were able to examine many interesting algorithms,” CEO Mark Risher wrote in an email. Facebook has run several Kaggle contests to find new talent as well.

There are other crowd-sourced methods that I wrote about for Slashdot here that can be very effective at locating talent. These include homespun efforts along with sites such as ProjectEuler.net, HackerRank.com,India-based CrowdAnalytix.com, Innocentive.com (for the life sciences), and TunedIT.org (mainly for education and research projects). But Kaggle has been around since 2010 and has the largest audience. For all of these sites, what is interesting is that you can quickly search for the contest winners: there is no mystery in most cases about who won or what they did.

But while these examples are suitable for finding your next programming superstar, it may be awhile before Big Data techniques can yield candidates for more common positions such as marketing managers or assembly line workers. Still, it is an area worth keeping in mind.