When it comes to convincing your boss of the value of a data dashboard, nothing works better than when you can save some dollars as a result of a trend that you visualized. This is what one of the data-driven marketing staff did for the Texas Rangers baseball team; their dashboard saved about $45,000 in annual costs.
The Rangers are big fans of data dashboards, and they should be: dashboards can spot trends, communicate a particular position to management, or call out trouble spots while you can still doing something about it. I heard from Sarah Stone, who is the marketing and advertising manager for the team and also a Big Data junkie.
Stone gave a talk at the annual Tableau Software user conference held earlier this month near their Seattle headquarters; I also met with her separately to get more information about her situation. She told me that she was new to the team’s front office (as they call the folks who don’t actually get into uniforms) and was looking to support one of her colleagues who were involved in a discussion with one of their long-time contractors. Their contract was up for renewal and thanks to Stone’s help they were able to produce a visualization that was used to shave off $45k from the contract. This was a great example of how data science could be used to benefit other marketing and sales efforts.
Tableau Software is big into dashboards and I came across many of them during their conference. One issue is that they can easily overpower management, who may be used to squinting at a series of spreadsheet figures. “The first time you show your boss a visualization can almost be a magical moment, it can really reveal things in your data that weren’t very obvious before,” said a data analyst at a Defense Department contractor I met at the conference. At another session, Vaidy Krishnan, an analyst from General Electric’s Measurement and Control group said, “Dashboards are just a starting point for a discussion. You can’t get everything right out of the gate but using them helps you ask critical questions.”
Stone is the person who has to decide on television and other media advertising buys for the baseball team and has to spend wisely: she needs to know which games are selling slowly, or what kind of ticket buyers are likely to come to which games. To do this, she uses Tableau Software’s tools and connects to several public and private data sources to produce her visualizations.
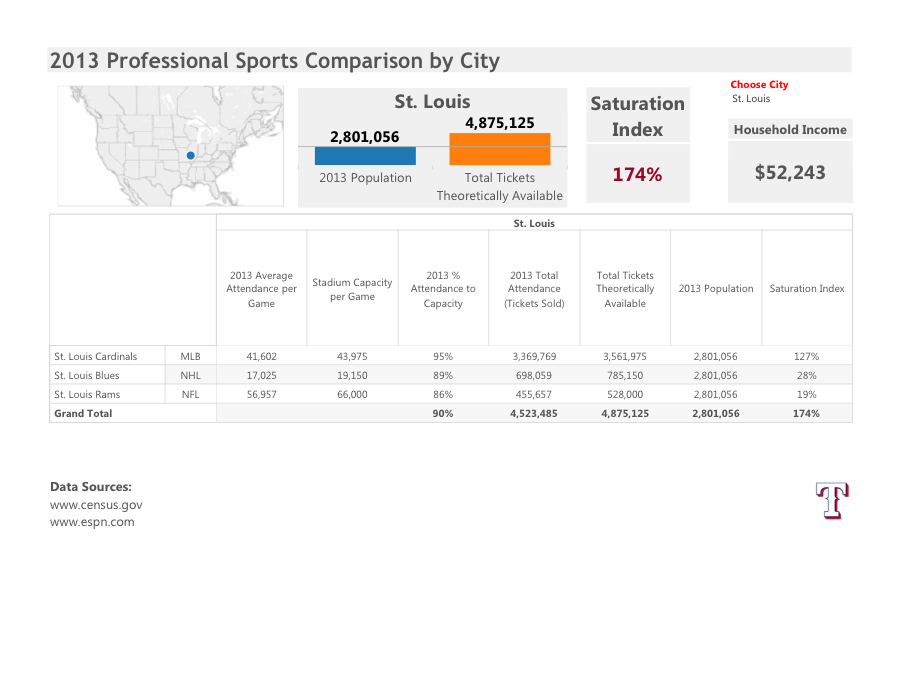
For example, she wanted to see whether the Dallas market was saturated with professional sports teams and used census data to compare the raw number of seats for each metropolitan market. Not surprisingly, St. Louis (as shown below) showed lots of rabid sports fans (something that I can attest to, after living there for several years) while Dallas still had room to grow.
Another analysis looked at how they could save money on their corporate cell phone bills. She was able to find several staffers who were frequently on scouting trips out of the country, and try to adjust their plan to handle more international minute usage. “We also saw a spike in the bills during August but then figured out that was when the whole team was in Toronto for a series of games, so it made sense.”
Her work on tracking ticket sales is an example of how a typical Big Data analysis session goes. Often, you don’t know what questions to ask or how to go about collecting the data that you’ll need for your analysis. At the conference, Neil deGrasse Tyson, the director of the Hayden Planetarium in New York, gave one of the keynotes where said the “really difficult thing was formulating questions that we are currently too stupid to ask now, let alone understand the answers to.” He gave as an example if someone from the 1700s were to try to figure out when the next asteroid would hit the Earth. No one from that era would have even asked such a question.
Stone admits that she often will run several queries and create several different data dashboards before she figures out what she is trying to accomplish. This is very typical behavior in the Big Data world. She is in the process of putting together an interactive seating chart of their stadium, showing characteristics of which seats were purchased by season ticket holders, what concession sales happened on particular games, and whether promotions or team performance helps to fill seats.
Not surprisingly, all those bobble-head doll giveaways do drive ticket sales. “And a post-season win translates into three seasons of subsequent increased sales,” she told me. Some of the data is downloaded from StubHub, the secondary ticketing retailer that Major League Baseball helped start. She is also working with the local Southern Methodist University business school students as interns to help integrate regression models based on R.
“Our sales department knows what they are doing when it comes to selling tickets, but when it comes to looking more globally at this process and how it coincidences with other variables such as team performance or the weather, they need help.” For example, her analysis can predict attendance so the team can better staff the stadium for more crowded games.
Before she started, the marketing department had to make frequent requests for reports from the box office, and these reports didn’t reflect real time sales either. “Producing real-time, holistic visualizations is the holy grail. We’ve always been able to obtain real time data, but it hasn’t been all that accessible and only a few people could gather that information,” she told me. “Our seat inventory is very perishable, and if I can design a discount program or arrange for an ad media buy for the next day’s game, it can have a big impact. Having a stale report doesn’t really help if you are trying to move thousands of tickets. We need to know how sales are trending because once the game is over, we can’t sell those tickets anymore.”
Ironically, when she started with the Rangers last year, Stone knew virtually nothing about baseball—she jokes that she didn’t even know the difference between an out and a hit then. (Now her game knowledge has improved to the point where she accurately scores each game she watches.) She came to the Rangers from another competitive landscape: professional politics, where she used data analytics to help focus media buys and to track what the other candidates were doing. “Really, politics and baseball are very similar,” she told me. “Both marketing groups have no control over the quality of the product you are promoting and you still have to get people to either come out to vote or to go to the game. Data is still data.”