Slashdot: The Brave New World of Crowdsourcing Maps

In our story last month, we covered various crowdsourced community methods, looking at the combination of Kaggle contests and Greenplum analytics. There are other examples besides this collaboration where communities are leveraging their own people and data, and some of the most illustrative quite literally are what people are doing to build their own specialized maps.

A map is a powerful data visualization tool: at one glance, you can see trends, clusters of activities and track events. Edward Tufte, data visualization expert, explains how one doctor’s mapping of a Cholera outbreak in 1850’s London was able to track the cause of the epidemic – a bacterium that was transmitted through infected water – to a particular street corner water pump. The good doctor didn’t use Hadoop but shoe leather to figure out where people who were getting sick were getting their water supply. And what is interesting is that this is long before the actual bacterium was discovered in the 1880s.

Enough of the history lesson. Let’s see how crowdmapping and big data science are bringing new ways to visualize data in a more meaningful context.

As one example, last month I was visiting our nation’s capital and noticed that on many streets were racks of bicycles ready to be rented for a few dollars a day. These bikesharing programs are becoming popular in many cities – New York is set to roll its one out sometime soon. The DC program has been in place for about a year, with more than 1600 bikes spread across the city in 175 different locations. Now the operation, called Capital Bikeshare, wants to expand across the Potomac River into the Arlington, Virginia suburbs. So they decided to crowdsource where to put these new locations, and set up this site here to collect the suggestions. On the map you can see locations that the community has suggested and where county planners have recommended, along with of course the locations of the existing stations. You can also leave comments on others’ suggested locations. It is a great idea and one that wouldn’t have been possible just a few years ago, when these mapping tools were expensive or finicky to code up.

Some other successful crowdmaps can be found in some unusual locations. While we traditionally think that you need a lot of computing power and modern data collection methods, crowdmapping is also happening in places where there is little continuous electricity, let alone Internet access, in many places in the third world.

For example, outside of Nairobi Kenya a neighborhood called Kibera was a blank spot on most online maps until a few years ago. Then a bunch of residents decided to map their own community, using online open source mapping tools. It has grown into a complete interactive community project, and as you can see from the map below important locations such as running water and clinics are shown on the map quite accurately.

In another third-world crowdmap is one that is just as essential as the Kibera project. This effort, called Women Under Siege, has been documenting the history of sexual violence attacks in Syria. The site’s creators state on their home page, “We are relying on you to help us discover whether rape and sexual assault are widespread–such evidence can be used to aid the international community in grasping the urgency of what is happening in Syria, and can provide the base for potential future prosecutions. Our goal is to make these atrocities visible, and to gather evidence so that one day justice may be served.” You can filter the reports by the type of attack or neighborhood, and also add your own report to the map.

One of the first community mapping efforts was started by Adrian Holovaty in 2007 in Chicago, mapping city crime reports to the local police precincts. Since then the Everyblock.com site has been purchased by MSNBC and expanded to 18 other cities around the US, including Seattle, DC, and Miami. “Our goal is to help you be a better neighbor, by giving you frequently updated neighborhood news, plus tools to have meaningful conversations with neighbors,” the site’s About page states. You can set up a custom page with your particular neighborhood and get email alerts when crime reports and other hyperlocal news items are posted to the site. The site now pulls together a variety of information besides crime reports, including building permits, restaurant inspections, and local Flickr photos too. This shows the power of the map interface, making this kind of information come alive and meaningful to those who live near these events.

Another effort is called SeeClickFix, which has mobile apps that you can download to your smartphone where citizens who see a problem can report it to their local government and provide detailed information. It was most recently used by various communities that were hard hit by Superstorm Sandy in October, such as this collection of issues from Middletown Conn. area as seen below:

Google put together its own Sandy Crisis Map and displays open gas stations and other data points on it to help storm victims find shelter or resources.

Communities are what you define them, and not always from people living near each other but who share common interests. Our next map is from California’s Napa Valley, home to 900 or so wineries in a few miles juxtaposition. David Smith put this map together that shows you each winery and when they are open, whether appointments are required for tastings, and other information. Once he got this project started, Barry Rowlingson added on to it using R to help with the statistics. What makes this fascinating is this is just a couple of guys who are using open source APIs to build their maps and make it easier to navigate around Napa’s wineries.

Here is another great idea for mapping very perishable data. There are several cities that have implemented real-time transit maps that show you how long you have to wait for your next bus or streetcar. There are dozens of transit systems that are part of NextBus’s website, which mostly focuses on US-based locations. But there are plenty of others: Toronto’s map can be found here, and Helsinki’s transit map can be found here. You can mouse-over the icons on the map to get more details about the particular vehicle. The best thing about these sorts of sites are that they are very simple to use and encourage people to take transit, since they can see quite readily when their next bus or tram will arrive at their stop.

If I have stimulated your mapping appetite, know that there are lots of other crowdmap sites, including Crowdmap.com, ushahidi.com and
Openstreetmap.org, along with efforts from Google. They are all worthy projects, and combine a variety of geo-locating tools with wiki-style commenting features and interfaces to attach programs to extend their utility.

If you want learn more, here is a Web-based tutorial offered by Google’s Mapmaker blog that will show you the simple steps involved in creating your own crowd map and how to find the data to begin your explorations. Here is a similar tutorial for CrowdMap. Good luck with finding your own map to some interesting data relationships.

Welcome to the omnichannel

One of the biggest problems for ecommerce has always been what happens when customers want to mix your online and brick and mortar storefronts. What if a customer buys an item online but wants to return it to a physical store? Or wants an item that they see online but isn’t in stock in their nearest store?
This isn’t a new issue. I remember teaching ecommerce intro classes at various Interops around the world back in 1998 and having to address the problem then. In one of my classes, we had the developers from the US Postal Service that were trying to figure out how they could manage their stamp inventories and not end up selling stamps that they no longer had in stock.

But today it is become more of an issue, especially as the growth in online sales continues to rise. And while supply chain management gets a lot of attention, what should drive a company is how demand for its products are tracked.

I spent some time this week at the Teradata Partner User conference and got to hear first-hand from Wade Latham, the Director of Business Process at Macy’s. Macy’s has three physical store chains totaling 800 stores and two online business units. They have operated independently but recently have begun to manage their demand chains more carefully.

Latham said, “We wanted our customers to buy anywhere and be able to fulfill the order from anywhere.” The problem was that their original processes were mostly manual or used Excel spreadsheets to track demands. “We couldn’t recognize seasonal or climate differences among our stores, and couldn’t really accurately forecast inventory levels. We also wanted to collaborate and share information both internally with our merchants and externally with our vendors for better planning, so they would have the product to ship us when we need it.”

The problem for Macy’s is that they buy stuff six to nine months before any of the items are on their shelves. But they wanted to start forecasting their demands when they made the purchase, so they could plan in advance. One of their biggest decisions is when to buy two of something. You would think that a chain of department stores would be purchasing things in greater lots than two, but because they sell about a tenth of each SKU each week, this can be an issue. Some of their departments sell things faster than others, and some stores – such as their flagship store on Herald Square in Manhattan – sell a lot of stuff even faster still.

The goal of demand chain management is bottom-up forecasting. You collect a lot of assumptions and dial in things such as the type of ethnic population that visits your store: having more Asian-American shoppers means you will sell more smaller sized merchandize, which makes sense.

Macy’s switched to Aprimo’s Demand Chain Management software, and used several of its retail-specific modules for intelligent stock item introduction monitoring and to track clusters of item profiles. “We focused on the opportunities surrounding replenishment of our stock, because they have higher profit margins,” he said. “Now we account for seasonality and can rank our stock items by location and know exactly what inventory we have on hand.” About 40% of Macy’s stock has been entered into the new system, which took about 18 months to build from start to finish. Latham says Macy’s is seeing a seven percent sales increase and more frequent inventory turns as a result, and a lot more satisfied customer base too.

All this means that the omnichannel is here to stay, especially for retailers who are trying to manage multiple demand chains.

Slashdot: Coping with Too Much Data: How Boeing, Nike and Others Did It

Businesses wring their hands over having too little data. But what happens when you have too much of the same data? Figuring out conflicting reports, deciding between different metrics, and removing duplicate entries can prove an enormous drain of time and resources—especially for some of the world’s largest companies, which have implemented too many data warehouses, or data marts, that tell different stories about the same business processes or events.

Every executive wants workers to run reports that present accurate and consistent information—no matter what the data’s origin. At this month’s Teradata User Conference in DC, I heard from a number of IT architects on how they handled the situation and got their data more “truthy,” as Colbert might say.

Here is my full report about how some companies have coped from Slashdot.

Slashdot: Segregate your data owners by personae


Positing particular personae (say that slowly) isn’t something new when it comes to website design: The FutureNow guys have been doing it for more than five years, and there are a number of other content engagement “experts” that have their own ways at better segmenting and understanding your ultimate audience. The process of using particular personae can be a way to develop websites that can deliver higher click-through rates and improved customer experience. All well and good, but what about improving the internal data access experience too?

That was the subject of a session at the Teradata Users Conference in Washington DC in October. I heard about how you can use personae to segregate and better target your data owners and data users. It is an intriguing concept, and one worth more exploration.

(An example of virtual data marts at eBay, more explanation below.)

slash

The session was led by Gayatri Patel, who works in the Analytics Platform Delivery team at eBay and has been around the tech industry for many years. There aren’t too many places that have as much data as eBay has: each day they create 50 TB’s worth and they have more than 100 PB per day that is streamed back and forth from their servers. That is a lot of collectibles being traded at any given point. And something that I didn’t really understand before: eBay is a lot more than a marketplace. They have developed a large collection of their own mobile apps that are specific for buying cars, or fashion items, or concert tickets for their specific audiences. In the past they have had difficulties in trusting their data, because two different metrics would come up with different numbers for the same process, so that often meetings would be consumed with different groups presenting conflicting views on what was actually going on across their network.

Patel has come up with mechanisms to focus her team’s energies on particular use cases to better understand how they consume data, and to supply her end users with the right tools for their particular jobs. To get there, she has worked hard to develop a data-driven culture at eBay, to identify the data decision-makers and how to help them become more productive with the right kinds of data delivered at the right time to the right person.

Let’s look at how she partitions her company of data heavyweights:

  1. First are the business executives who are looking at top-line health and metrics of their particular units and have relatively simple needs. They want to drill down deeper to particular areas or create operational metrics and get more narrow and focused areas of particular data sets. Let’s say they want to see how weather-caused shipping delays from sellers are impacting their business. These folks need dashboards and portals that are one-stop shops where you can see everything at a glance, post your comments and share your thoughts quickly with your business unit team. Patel and her group created personal pages with a “DataHub” portal called Harmony, that makes sure all of their metrics are current and correct, and where the executives can bookmark particular graphs and share them with others.
  1. Second are product managers who are looking to learn more about their customers, and want to do more modeling and find the right algorithms to improve their marketplace experience. “We followed some of our managers around, attended their meetings and tried to understand how they use and don’t use data,” Patel said. Her team came up with what they call the “happy path” or what others have called the “golden path” – the walk that someone takes during their daily job to find the particular dataset and report that will help them do their job and make the best decisions. “Each product team has a slightly different path in how they interact with their data,” she said. “Our search development teams are more technical and data-savvy than the teams who work on eBay Motors, for example.” Her team has to constantly refine their algorithms to make the happy paths more evident and useful and well, happier for this group of users.
  1. Third are data researchers and data scientists. These folks want to go deep and understand how everything fits together, and are looking to make new discoveries about particular eBay data patterns. They want more analysis and are constantly creating ad hoc reports. Patel wanted to make this group more self-sufficient so they can concentrate on finding these new data relationships. Her team created better testing strategies, what she called “Test and Learn,” which has a collection of short behavioral tests that can be quickly deployed, as well as more longitudinal tests that can take place over the many days or weeks of a particular auction item on eBay. “We want to fail fast and early,” she said, which is in vogue now but still is something to consider when building the right data access programs. Patel and her team have developed a centralized testing platform to make it easier to track company-wide testing activities and implement best practices.
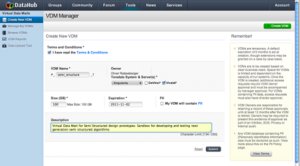
  1. Next is your product and engineering teams. They do prototypes of new services and want to measure their results. These teams are creating their own analytics and constantly changing their metrics using methods that aren’t yet in production. For this group, Patel made it easier for anyone to create a “virtual data mart” which can be setup within a few minutes, so that each engineer can build their own apps and create specific views pertinent to their own needs. (A sample screen is shown above.)

eBay has three different enterprise data efforts to help support all of these different kinds of data users. They have a traditional data warehouse on Teradata, three of them in fact. They have a fourth warehouse which is semi-structured and called “singularity” that has more behavioral data for example. Finally, they use Hadoop for unstructured Java and C programs to access. The sizes of these things is staggering: Each of the traditional data warehouses is 8 TB and the other two are 42 and 50 PB respectively.

As you can see, the eBay data landscape is a rich and complex one with a lot of different moving parts and specific large-scale implementations that meet a wide variety of needs. I liked the way that Patel is viewing her data universe, and having these different personae is a great way to set her team’s focus on what kinds of data products they need to deliver for each particular group of users. You may want to try her exercise and see if it works for you, too.

How Liberty Mutual built their first mobile app with Mendix

One of the largest insurers in the US was looking to roll out a new mobile app for its group insurance customers. Chris Woodman, an IT manager at the firm, described at Mendix World the process they went through and how Mendix was a key element to their success.

“In 2011, we wanted to develop a mobile app, but we didn’t know what we were getting into, and we had no previous mobile development experience,” he said. “Two months later we had our app deployed.” Mendix awarded the project as the outstanding effort of the year at the conference.

You can read more of my report on Liberty Mutual’s efforts from the Mendix blog here.

There are other entries that I authored during the show, and here are their links. Mendix definitely has an interesting story to tell. Here are the original stories that I filed and since then taken off their blog.

  • How fast can you deploy your apps?
  • John Rymer from Forrester describes his favorite mobile apps
  • Wrap of the first day at the confrence
  • Ron Tolido of Cap Gemini Europe spoke about whether your company has a business prevention department
  • The student programming competition
  • Wrap of the second day of the conference

Slash BI: How B.I. and Data Make a More Efficient Farm

Business intelligence is not just for big-city businesses anymore. B.I. has come to agribusiness, with farmers and cattle ranchers using many of the same tools found in numerous corporate cubicles. Thanks to everything from sophisticated tractor instruments to automated milking machines, farmers can collect all sorts of operational data in order to improve efficiency and keep production levels high.

You can read the full story over at Slashdot here of several examples of what is going on down on the farm.

SlashBI:Do You Need a Chief Data Officer?

The city of Philadelphia recently hired Mark Headd as their Chief Data Officer, and we are beginning to see this title crop up more frequently since it first came into being several years ago. Why should your organization have one and what do they do that differs from the CIO, CFO or CTO?  

Headd is an interesting choice. He comes from Code for America and ran several open data projects in his career, being a big supporter of numerous civic hackathons and using technology to open up government data to the public. <a href=”http://www.newsworks.org/index.php/local//innovation/42657-meet-mark-headd-philadelphias-first-chief-data-officer”>He is “making sure agencies aren’t reinventing the wheel, running into the same problems,” Headd said to the NewsWorks blog here</a>. “You get someone who can take a holistic view across city government and be strategic about the city’s use of data,” he added.

And the title is taking hold. <a href=”http://www.information-management.com/news/data-steward-chief-data-officer-goldensource-10022664-1.html”>”Over 60 percent of firms surveyed are actively working towards creating specialized data stewards, and eventually Chief Data Officers, for their enterprise,” according to a recent survey by GoldenSource Corporation cited in Information Management Magazine here.</a>

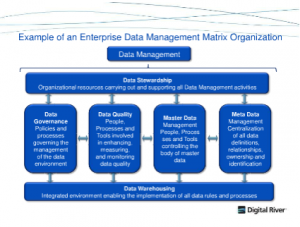
In a presentation by Deepak Bhaskar, the Senior Data Governance Manager at Digital River, he shows that this isn’t so simple, and that managing data across the entire enterprise can take on many dimensions.

Some organizations have begun to even identify their CDOs on their websites, as the <a href=”http://www.fcc.gov/data/chief-data-officers“>Federal Communications Commission does here. </a> They claim to be the first federal agency with the title, and have CDOs in each bureau or specialized office such as wireless or wireline communications. It is a notable effort.

Consulting firm Cap Gemini, among others, says that ideally one person should be focused on the quality, management, governance and the availability of data. It is about treating data as a strategic asset. <a href=”http://www.analytics-magazine.org/septemberoctober-2011/401-chief-data-officer-new-seat-in-the-c-suite”>But most organizations don’t give data the same kind of attention as other corporate assets</a> such as people or expenses, write Rich Cohen and Ara Gopal for Analytics Magazine last year.

That is ironic, because as IT departments move towards bring-your-own-devices and cloud-based computing, they should be more focused on their data. As one corporate IT manager from a large manufacturing firm told me, “Nowadays we don’t own the devices, we don’t own the servers, we don’t own the networks that connect them, and we don’t own any of our apps that run on these devices. All that we have left to derive value from is our data.” How true.

Why consider a CDO now? Several reasons. “Enterprise data is no longer black and white,” says Cohen and Gopal, meaning that data can be found anywhere and everywhere. Indeed, in some cases, IT departments can’t even figure out where their data actually lives. Chris Wolf, an analyst at Gartner, spoke about one firm that he interviewed that made a recent upgrade of its Microsoft Office suite from 2003 to 2010 version. In that upgrade, they lost support for an aging Access 2003 database that they weren’t aware of, yet was used by dozens of employees for their mission-critical data by one department. Oops.

Just think about all your customer interactions today. You can have a collection of text messages, blog entries, social network posts, mobile applications, your own and customer-generated videos, Tweets, emails, and even Instant Messages. How can you track all of this data? Ultimately, one person needs to be in charge and see the entire data landscape.

Another reason is that “recent regulatory reforms have placed an even higher emphasis on data accuracy and the risks associated with the lack of end-to-end visibility,” say Cohen and Gopal.

What is the role of the CDO?

<a href=”http://smartdatacollective.com/brett-stupakevich/52217/top-3-reasons-you-need-chief-data-officer”>Brett Stupakevich, writing in a blog on Smart Data Collective</a>, thinks that CDOs should have three primary responsibilities: data stewardship, or being the chief owner of all enterprise data; data aggregation, or being responsible for “building bridges between business units and creating an enterprise focus for the data”; and communicate data schemas and eliminate any semantic differences among enterprise data. That is a nice way of thinking about it.

Cohen and Gopal add that the CDO should “develop capabilities to measure and predict risk and influence enterprise risk appetite at the executive table.” The CDO should also be watching the top line revenue numbers and bottom line as well.

“The one skill that helps me a lot in my current job is to interact well with people, so I lead my team efforts to better serve the business needs of my C-Level peers,” says Brazilan CDO Mario Faria on a LinkedIn forum. “Technical and business skills are necessary however not sufficient for this job.”

Whom should the CDO report to?

Cohen and Gopal ask a very good question: “Does the CIO report to the CEO or to the CFO; in other words, is the IT organization seen as an integral part of the corporate strategy or it is seen as a cost center that enables day-to-day business operations?” But there could be a larger issue, namely, does the entire C-suite buy into the CDO as another peer? Cohen and Gopal also say, “it can be difficult to secure executive backing unless the CDO initiative is seen as a direct response to a burning business problem.”

Depending on your own organization, a CIO with enough revenue authority – or a CFO with enough IT authority — might be called a CDO. But it isn’t so much the title but what the person is actually responsible for and how much visibility into a corporation’s data footprint they actually have.

<a href=”http://www.linkedin.com/groups/Can-present-CFO-CIO-play-1863121.S.110000183?qid=b6051d7e-21d2-481f-9107-a06726ab77cf&trk=group_most_popular-0-b-ttl&goback=.gmp_1863121″>But not so fast, according to many members of the CDO LinkedIn group who responded to this very question</a>. “Each role (CIO and CDO) has its purpose and everything can not be under control thanks to a single function. And even more in big company,” said one poster.

It seems that CDO has yet to find its way to corporations involved in Big Data. Chief Scientist for Bit.ly Hilary Mason told me “I don’t know that many people with the specific title of Chief Data Officer. It seems like that would be a title found at larger corporations, but I like that it implies that whoever controls the data actually reports directly to the CEO.”

SlashBI: Lessons Learned From Boeing’s Data Analytics Experiments

It wasn’t all that long ago that Boeing didn’t even have an IT department, let alone any processes in place to make use of the massive amount of data it collected to improve its aircraft manufacturing efforts.

But today’s aircraft couldn’t be manufactured without a significant amount of BI and data management. Boeing today moves 60 petabytes around its network, and the company is in the middle of several Big Data pilot projects as well. Let’s see what they’ve been cooking up.

You can read the full article here on Slashdot/BI.

Gartner Catalyst Conference: Tales of IT Daring-Do

I was fortunate enough to attend the Gartner annual Catalyst conference this past week, where I heard some interesting stories from IT managers about their innovative approaches. Here are links to them:

Slashdot: Public Data: Where to Test Your Next Big Data App

When building Big Data apps, you need to conduct a test run with someone else’s data before you put the software into production. Why? Because using an unfamiliar dataset can help illuminate any flaws in your code, perhaps making it easier to test and perfect your underlying algorithms. To that end, there are a number of public data sources freely available for use. Some of them are infamous, such as the Enron email archive used in court hearings about the malfeasance of that company. You can read more of my article that appeared today in Slashdot here.