ITworld: 6 mapping trends from Techonomy13

streetrx2If you haven’t yet gotten into mapping your data, now might be a good time to take a closer look at the technologies available. While maps have been around for thousands of years, the digital kind are a more recent innovation and more of a communications language, to visually display content and get context. Plus, they are universally recognized by everyone.

In this article for ITworld and the accompanying slideshow of maps, I talk about six trends that businesses can capitalize on with using these tools.

Website Lessons Learned from Williams-Sonoma

Is your website as classy as your brand?

For Williams-Sonoma, Inc., the goal is to match great looking Web pages with top-shelf analytics to keep track of customers.

“Data science is brand building here,” said Mohan Namboodiri, VP of Customer Analytics for the San Francisco-based retailer. “We have a heritage of scouring the world for fantastic products,” he told the audience at the Teradata 2013 Partners conference earlier this month in Dallas. “We bring that same sensibility to doing our data analytics.”

While Williams-Sonoma began with a traditional brick-and-mortar store and a mail-order catalogs, the company has “come of age online,” he said.

Namboodiri explained that there are several routines and techniques the company uses to track customers. Here are some of the highlights:

Segment users by persona

  • Williams-Sonoma groups site visitors into various usage clusters and behaviors. These groups can help Namboodiri’s team understand what different online shoppers are trying to do and how they’re using the site. This both helps inform site navigation and improve conversion rates.

Use cookies to model and score customer behavior

  • Each browsing session is tracked with a unique cookie to determine what customers are doing. Data is used to provide feedback to personas; allowing the company to group customers and test the performance of the personae.

Guide customers based on their actions 

  • Various triggers have been programmed to respond to particular customer actions. For example, if a visitor searches for an item that’s put on sale in its stores, he would be guided to the best way to buy. “It could be borderline creepy, but it is a sale and so saving customers money trumps that,” he said.

Apply online data to retail forecasts

  • The more online visitors buy a particular items, the more the company stocks them at retail outlets. This information impacts Williams-Sonoma’s supply chain and even inventory decisions of stores in particular neighborhoods. Namboodiri’s team analyzes these purchases over time to help improve each store’s inventory moving forward. Given the number of different furniture styles, colors, and options, you can imagine this can be quite critical to having the right goods in the right stores.

Like any great Web storefront, Williams-Sonoma recognizes that design and analytics will always be a work in progress. That’s why Namboodiri and his team constantly experimenting with other ideas to keep things fresh. At the Teradata conference, there were no shortage of great ideas. By developing a website that elegantly weaves together design and analytics, good things happen for both company and customer.

Does your relationship have enough diversity?

The old saying that opposites attract now has some mathematical validity, at least according to a new research pre-print made available this week. The paper, by Lars Backstrom of Facebook and Jon Kleinberg of Cornell University, looks at Facebook friend network data and link. The authors attempt to predict a member’s spouse or romantic partner from the shape and density of their network.The authors built some algorithms and do so successfully.

To aid in their model, they invent the concept of network dispersion to characterize your friend network. Their measure of dispersion isn’t what you might initially assume: the more the better. Put another way, the more diverse your friend collection is between you and your spouse, the more powerful a bond is between the two of you and the more likely it is your marriage (or relationship) will last longer. The two authors also did time-series analysis, looking at how your friend networks change and relate that to your changing relationship status that you post publicly to Facebook.

Another interesting result from the paper is that the researchers used two different datasets: one was a subset of the other and focused on larger and denser friend networks. Both sets used randomized and anonymous data from across a large swatch of Facebook members. The results were very similar, showing diversity doesn’t matter how big your network is.

It is also heartening to see that people who are “connectors” (as Brad Feld uses the term) play important roles in one’s friend network. We connectors (and I count myself among the group) are the ones who create the network path diversity, and help to stitch together the smaller sub-groups that boost the dispersion factor. This makes sense to me.

There are many other efforts involved in mapping relationships, including one that Dean Collins developed one many years ago but it is no longer available.

One that you can access quickly and free is LinkedIn Inmaps here. When I first heard about this program several years ago I was fascinated with my own map, but sadly, they have tuned the software to only look at smaller networks than mine. Perhaps your account will be able to work with their software.

So there you have it: not only do opposites attract, but they stay attracted longer. If you have any links to other relationship mapping or visualizations, share them here in the comments.

Smartbear: How Riot Games conquered Hadoop, seriously

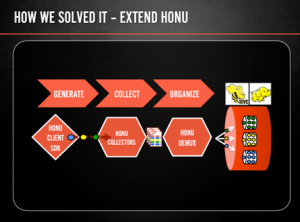
honuLife at a gaming company isn’t always fun-and-games. It’s also a demanding IT environment with a huge amount of data to manage. Using various Hadoop open source tools (including Honu, see the diagram at right), the gaming company behind League of Legends supported hypergrowth and delivered more timely analytics. I spent some time with them at the StampedeCon conference to learn more about how they pulled this off.

My article in Smartbear’s blog can be found here.

Come See the Software Side of Sears

Thanks to Apache Hadoop and other data-analytics technologies, the international retailer Sears has managed to not only transform its IT operations, but also decommission some of its mainframe computers. The company has been so successful with this project that it has spun off the group responsible into a separate company that is now selling its services to others. Call this one of the bigger proof-points of using Hadoop in the enterprise.

Read the rest of my article on Sears at StampedeCon here on Slashdot and see the software side of Sears.

Modern Infrastructure: Hyperscale data center means different hardware needs

Remember when data centers had separate racks, staffs and management tools for servers, storage, routers and other networking infrastructure? Those days seem like a fond memory in today’s hyperscale data center. That setup worked well when applications were relatively separate or they made use of local server resources such as RAM and disk and had few reasons to connect to the Internet.

I describe the new needs of the modern hyperscale data center in an article for Modern Infrastructure Magazine here.

Solution Providers for Retail: GPS in Retail Stores Helps Convert Browsers to Buyers

esr

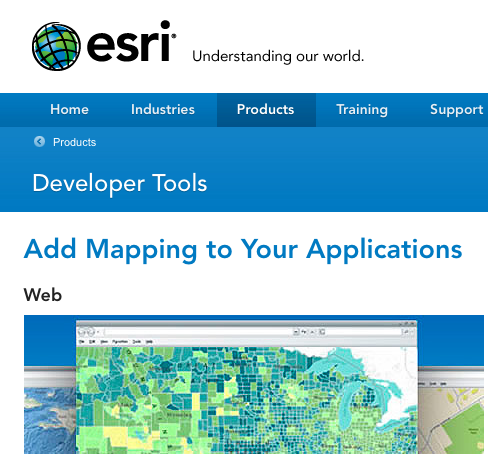
In my post on geofencing, I mentioned efforts by a number of retailers to make use of location-based information. There is another perspective on location, that of the provider of the geospatial databases that drive many of the location-aware mobile apps that are being developed. Redlands, Calif.-based ESRI has been one of the leaders in this space. I spoke to two of their key managers about how they work with developers and how their business is changing.

“We have a forty year history of doing location analytics very well,” said Simon Thompson, their Director of Commercial Solutions. “We now offer a wide range of things ranging from sentiment hot spot analysis of social media check-ins to tracking people’s behaviors and matching them up with demographic predictions.”

Location-awareness has gone through an evolution over the past several years, starting with the realization that most of us don’t want to install multiple location apps on our smartphones. “Consumers want valuable insight delivered to them as part of their existing browsing experience,” Thompson said. ESRI can now use anonymous tracking cookies inside the mobile browsers to see where these mobile phones travel and differentiate patterns based on time of day or particular geographies. “This is a much broader segment than just those who check in on Foursquare,” he said. “Location has become an essential data source in a wide variety of apps.”

At its start, ESRI built their mapping APIs for a professional or geo-centric audience, and has lately evolved into a providing a more accessible developer experience. “We wanted to simplify things for the developer who maybe wanted to dip their toe into the shallow end of the pool first and try out location awareness,” said Bronwyn Agrios, ESRI’s Mobile Business Development Manager. Things seem to be working for them: their sales are booming. They are quickly signing up retailer customers and VARs, making this market segment their biggest growth area. “We have most of the big commercial retail chains as customers,” said Thompson.

So are there any special skills needed to take advantage of ESRI’s location APIs? Not really. “Any mobile developer can easily become a location-aware developer,” said Agrios.

One example of an IT-related retail partner of ESRI’s is Aisle411, a service that allows shoppers of more than 12,000 retail stores to pinpoint a particular product on a shelf via an interior map of the store. Say you are trying to find that special sponge but haven’t a clue. You can bring up their app on your smartphone, have it go to the store map of the particular Walgreen’s you are shopping, and it will direct you from your current location to the appropriate aisle. Think of it as an indoor GPS.

Nathan Pettyjohn is their CEO and very happy working with ESRI, who helped with supplying some of the location data for their app. “Retailers have invested billions in their store assets, but there is a big hole in digitizing that asset so that shoppers can navigate their store. What we are trying to do is combine search and location intelligence, to trigger unique shopping experiences.” He mentions that people who use his app convert into actual buyers 93% of the time, a rate that is much higher than the average store browser who uses the old fashioned wander-and-hunt to find items. “ESRI has made it really easy to integrate their mapping interface to set up geo targets and triggers. A developer could try to create this on their own, but there are so many complexities about battery drain and different mobile OS,” he said.

Some might complain that there is too much data in ESRI’s databases. “It can be overwhelming initially, but that is a double-edged sword: it is also very rich too,” said Thompson. It might be time to find your way to their website and take a closer look at what they can offer.

Slashdot: Monsanto expanding its data analytics

monsanto ifs


Monsanto is more infamous for growing its genetically modified corn than its software, but a series of corporate acquisitions and a new emphasis on IT solutions has made it a firm that acts more like an innovative IT vendor than an agribusiness giant, and is definitely worth watching. They are a good example of how agribusiness companies are getting interested in Big Data, as we wrote about last year

At a presentation at a downtown St. Louis tech incubator entitled, “The Role of IT in Modern Agriculture,” Jim McCarter reviewed where the agribusiness giant is going with its IT efforts to an audience of entrepreneurs and civic leaders. McCarter is the Entrepreneur in Residence for Monsanto and has worked there less than two years. Before he came there, he ran his own biotech startup where he developed pest control molecules. He is also is a genetics professor at Washington University.

One of their goals is to produce crops that can double their yields by 2030. This focus on productivity and sustainable agriculture pervades the company. “IT is becoming increasingly central to what we do, and we are integrating IT into all aspects of our business now,” he said.

“Monsanto has become a data-driven culture.” The proof is how much data they now keep track of. (See the chart below.) One issue is that Monsanto is involved in efforts that generate huge amounts of bits: there are its genomic efforts, which have gotten public attention to be sure. But there are also phenotypes of millions of plant DNA structures that describe the various biological properties of each plant, and remote sensing photographic imagery of crop fields. All told they have several tens of petabytes that need storage and analysis, and it is doubling about every 16 months too. As a result, Monsanto has become a big user of Hadoop and H Base and other Big Data tools to manage all this data.

The company is headquartered in St. Louis with more than 21,000 employees in 500 different locations around the globe. About 5,000 of them are engaged in basic research and development, and the company is investing about $1.4 billion in R&D each year. While isn’t at the levels of an IBM or Microsoft, it is an impressive figure for a company that just a few years ago didn’t have many IT-related employees.

To give you some perspective, a quick search of job openings on Monsanto’s website this week shows 24 positions involving Big Data, including one for an IT Commercial Delivery Lead for Global Infrastructure that could have been lifted right from the pages of a bank or insurance company’s career pages. Another example is two current openings on Dice for Hadoop developers.

This isn’t the only iPad use case for Monsanto. They have deployed more than 1,500 of them to their field support staff to keep them in front of growers and spend less time on administrative work. The company also has several other IT-based initiatives such as FarmCare, to use mobile phone alerts about real-time weather threats to farmers, and North Star, a global supply chain transportation management system that has saved millions of dollars in overhead costs.

Monsanto isn’t trying to go at this alone. There have other IT collaborations going on, and are partnering up in specialized areas such as remote imaging, high performance computing and computational biology. This tracks with what other large multinational firms are doing as they capture more data and try to use it as part of their basic business decision-making.

Another way the company has grown over the last several years is through acquisitions. Last year they purchased Precision Planting. That company has been applying software to farming techniques and will form the first of Monsanto’s efforts in what it calls Integrated Farming Systems and its FieldScripts software. (See descriptive illustration below.) It is presently in beta and runs on an iPad that connects to the tractor planter controls. “Just like Amazon has its recommendation engine for what book to buy, we will have our recommendations of what and how a grower should plant a particular crop,” said McCarter. “All fields aren’t uniform and shouldn’t be planted uniformly either,” he said. The software will look at two different crops and different planting densities as a farmer is sowing his crop, taking into account geospatial data and other analytics about crop performance. “Farmers are very data driven,” said Erich Hochmuth, the data analysis architecture lead for Monsanto. “And when they hear that they can improve their crop yields by anywhere from five to ten bushels per acre, that gets their attention. That can add up, and can be a big motivation for farmers to adopt our technology.”
Light my bonfire

It is almost a cliche: put a bunch of 20-somethings together and the first business they want to start is building their own iPhone app. The second kind of business is something involving social media. And the third is something with sharing photos.

Yet if you look beyond these broad strokes there is something to be said with what a group of young entrepreneurs are doing in St. Louis with an app called BonfyreApp.com. It could be something that will change that social/mobile/photo space in spite of being part of that triple trendy collection of categories.

I have to say I was very unimpressed when I first heard about it, and was shown the app by one of its founders. Ho hum. Yet Another Social Mobile App. I showed it to my 20-something daughter, who also pointedly yawned. “Dad, I already spend enough time on Facebook and don’t need another network,” she told me.

But the audience for Bonfyre isn’t necessarily another medium for posting pix of people holding red cups filled with intoxicants. It is designed for brand owners to build engaging meetings and to tell their stories. When you pitch their idea that way, it begins to make sense.

When you go to a conference,assuming the conference is any good, you want to bottle some of that good feeling you get from the time spent and preserve those memories. Yeah, and you get the tote bag or backpack too. Maybe you want to capture a few scenes from the speaker’s presentations, or remember some of the folks that you met. Or whatever. So how do you do it now? Rather crudely, with a combination of Facebook photos, LinkedIn groups, email and texts. Links to Instagram or Pinterest photo collections. And a batch of business cards that if you were lucky you either scanned or annotated so you remember who that person was that you met.

The problem is that your stored common memory of the event is all over the place. None of the above mechanisms really work well. Facebook is too public, and navigating its sharing and privacy controls are like trying to set up the next NASA launch (or whomever is launching rockets these days). Texting is great if you want to share one or two photos with one or two people, but breaks down in the many-to-many context rather quickly. The LinkedIn group with its triple opt-in takes months to actually create and get going, by which time the group has moved on to other matters (and doesn’t really work anyway for sharing photos). And the stack of business cards gathers dust quickly as the memory of each individual fades.

That is the space where Bonfyre is trying to enter. The idea is that anyone can download the app to their phone and create these quick discussion groups and invite anyone else to them. There is a Web app for monitoring your discussions. You can be up and sharing content with specific people within minutes. No one else can view the content, unless they are invited in. Once the discussion is created, everyone in the group sees everything. It is mainly for sharing and commenting on photos, but you can also share messages too.Think of it as the virtual tote bag that can preserve your memories of the event.

I began to see the light when I was going to a party a few months ago, a party put on by the Bonfyre PR firm. That day I happened to be having lunch with one of Bonfyre’s founders. He showed me the discussion that was started by the PR firm’s owner, who was trying to figure out what shoes she should wear that night and had photographed several choices. Suddenly we were photographing our own sneakers and putting them online. Soon other attendee’s shoe pictures followed.

Now, granted this was our interpretation of the infamous red cup pix of so many 20-somethings’ nights out, but that is partly my point: no one else was going to see these pictures, unless you were going to the party. And we all had a good laugh when we finally got to the party and looked at each other’s feet.

But now let’s take this silly moment and move into what is actually happening with the Bonfyre app by meeting and event planners. At one conference of 500 people, 60% of the attendees were running the app, and 60% of them were sharing content with each other. At a Rams football game, they had 2000 people at the stadium using the app, and these people uploaded almost as many photos as the entire half million Facebook fans of the Rams. Think about that for a moment: you have all these folks in the stadium sharing their memories of the game with each other, interacting with each other and with folks watching the game around the world. If you were the marketing director of the Rams, wouldn’t you want to reach those folks and leverage this interest? If you were a Rams advertiser, wouldn’t you want to connect with these people, perhaps offer them something? Now you begin to see the power of what Bonfyre can do.

They haven’t gotten everything worked out yet: how they charge businesses, getting their analytics act together, and hiring a real sales team to promote their own brand still remain on the to do list. But this is one mobile, social, photo sharing app that you should take a closer look at. No matter how old you are. Try it at your next meeting or corporate event, and see if you can light your own bonfire.

ITworld: Try out your Hadoop app on the world’s largest cluster

Are you looking to be on the cutting edge of Big Data? How would you like to test and refine your Hadoop application to see if it can handle the largest known cluster? Then you might be interested in what EMC’s Greenplum unit is doing in its Las Vegas data center, where anyone can make use of their facility for free. Yes, you read that correctly. It has been in operation for less than a year, and is already getting rave reviews from more than a dozen different customers from all over the world.

I interviewed several customers of the cluster for a recent story in ITworld here.