Doing BI doesn’t have to be expensive <a href=”http://slashdot.org/topic/bi/business-intelligence-on-a-budget-open-source/”>, as we wrote about earlier this month here</a> when we looked at open source BI projects. But there are also plenty of commercial BI tools that don’t cost five figures, and some that are even available for free or minimal cost.
There are several factors that are making these tools popular. One is that the
iPad is <a href=”http://slashdot.org/topic/bi/apple-ipad-is-evolving-the-business-intelligence-market/”>the go-to BI executive dashboard, as we wrote about here</a>. Another is that BI is now becoming more a part of everyone’s job description, and not just for a few highly skilled analysts. There are also numerous BI service offerings in the cloud, encouraging more ad hoc kinds of queries. Finally, the tired old spreadsheet is, well, tired – and users are finally willing to abandon it for something better suited towards analysis of business trends. A <a href=”http://aberdeen.com/Aberdeen-Library/7884/RA-business-intelligence-analytics.aspx”>recent Aberdeen study</a> found that half of those BI IT managers surveyed needed better tools to make sense of their data.
There are several reasons why would you want to use them, when there are all these open source tools. Maybe you want to eventually trade up to a more expensive BI product: some of these commercial versions are made by the big league vendors and can give you a taste of what is in store for you. Or your users might not want to expend the effort involved in managing an open source project. Some of the commercial tools work with existing spreadsheet-based data but provide a lot more insight or visualizations. And there are a few vendors that specialize in mobile apps too. So let’s take a closer look at what is available.
First are <a href=”http://www.microsoft.com/en-us/bi/default.aspx”>some free tools from Microsoft that they call “labs”</a> – meaning that they might have more bugs than usual. They have tools that connect various Microsoft pieces of software together for deeper analysis. For example, PowerPivot (see the screenshot below) is an Excel add-on that can import and analyze data from Access and other data sources. Microsoft claims you can import thousands of rows of data and process them quickly. They also have extensions to SQL Server 2012 called Reporting Services that provide ad hoc data visualization, and there are online demos that you can try out to see how these tools work and whether they are appropriate for your particular needs. While no programming is needed, you do have to know your way around the various Microsoft services such as SQL Server, Silverlight and SharePoint.
 Four companies usually associated with more expensive BI software are Tibco, MicroStrategy, QlikTech and Tableau. They all have free lower-end offerings. Two of them are SaaS-based and have the caveat that the visualizations that are created in both tools are public. First is <a href=”https://silverspotfire.tibco.com/us/home”>Silver Spotfire from Tibco</a>. This tool allows you to create cloud-based interactive dashboards where you can take your Excel data and manipulate it. Their personal version is free and limited to 10 thousand rows with ten concurrent viewers. If you want something more powerful, or a version that can use private data, they have subscriptions starting at $99 per year. More expensive versions can access other databases or manipulate multiple datasets.
Silver Spotfire is the hosted version of Spotfire, and there are copious online demos and templates available from Tibco to show you what is possible. Tibco also has <a href=”http://spotfire.tibco.com/ipad.aspx”>an iPad version of Spotfire too </a>.
Then there is <a href=”http://www.tableausoftware.com/products/public”>Tableau Public</a>. Like Silver Spotfire, it can do data visualizations from Excel data and there are extensive galleries showing you what you can do with the tool. It also can connect to Microsoft Access, and is limited to 100 thousand rows. It is a Windows executable that works with the Tableau cloud-based services. Like Silver Spotfire, once you create a particular visualization, anyone with a Web browser can view it. If you want something for private analysis, Tableau comes in a variety of paid desktop versions starting at $1000.
There are two other downloadable tools that are intros to the more expensive BI offerings. One is QlikTech’s QlikView Business Discovery Platform has a Personal Edition that is free for the download</a>, registration required. It is a fully-functional version of the software that starts at $1350 per user and a server license at $8,400. Y
The other is from MicroStrategy, who has its free Reporting Suite that bundles in a bunch of different pieces of its paid BI line of tools, along with 60 days of free email support too. If you are looking into getting involved with this line of products, this is certainly the way to go.
But there are other tools that are from smaller software vendors that are worth taking a closer look as well. Many of these are geared toward particular mobile devices, or take your existing spreadsheet data into more interesting visualizations.
Roambi has two tools, Analytics and Flow. They have a free Analytics Lite account for individuals. This takes Excel data into its cloud and can send them to any iPhone or iPad. They also have paid accounts for private data that can also import data from Google docs and Salesforce. The Flow tool is more of an information publishing solution that will turn data into an interactive magazine that is viewed on an iOS device. It requires the paid Analytics tool.
Webalo is more of a data access tool and comes with support for the top four mobile device platforms: iOS, Android, BlackBerry and Windows Mobile. Using a simple set of Web screens in their Agenda interface, you can set up easy access to your corporate databases with a customized mobile app. And there is no programming required to build your app. You can choose to use a hosted solution or have the Webalo services running on a virtual appliance inside your firewall. Prices start at $100 per user per year for the hosted solution.
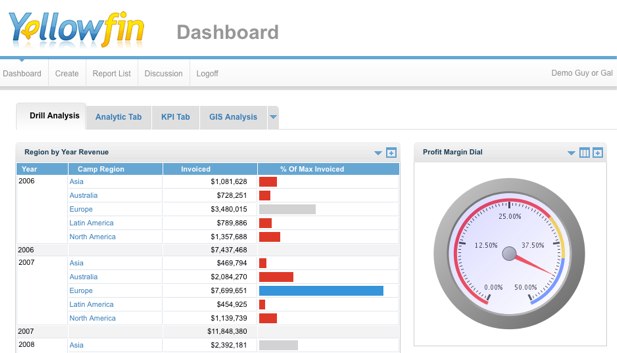
Finally, YellowFin is an Australia-based BI service. Their Web-based dashboard (see screenshot) is quite flexible and you can try it out for free on their site. There are also iOS and Android mobile apps too. Pricing starts at $600 per user per year.
As you can see, there are lots of inexpensive BI solutions that can bridge the gap between ad hoc spreadsheet models and more expensive solutions.