Like some of you, I got my first introduction to the PC from the spreadsheet. It has been around for more than 35 years in one form or another, and most of us have at least a basic working knowledge of how to use it for rudimentary calculations. In my computing career I have seen numerous spreadsheet abuses – it is amazing what people can force a spreadsheet to do for them. I actually wrote about this in 2014 for Intuit’s blog here.
One of the reasons that Excel and other spreadsheets are so abused is that it can be a very addictive tool, and users are fearful of having to learn something else. Another reason is given by Ron Shaich, the CEO of Panera Bread who says that too often middle managers “manage from the spreadsheet, viewing it as an oracle.They make decisions believing the numbers of the past loaded into the spreadsheet foretell future outcomes.” Sadly, the future is never as certain as we might hope.
If you can break from its charms, you can make use of your computer for a lot more useful activities such as data collaboration and analysis. For the former, you often see the spreadsheet context as a way to share a simple database (not surprisingly, Intuit sells one of these tools) among a work team. For the latter, there is the category of what has been called self-service business intelligence tools. I looked at the best of these for a review I did for PC Magazine last month of ten different BI tools.
The hard part is that these collaboration and analysis tools often have steep learning curves and make it trying to understand their user interfaces. Some products are better at data exploration than data analysis and reporting, so keep that in mind as you look at them. Some tools also cost five or more figures and thus aren’t very appropriate for smaller businesses. Finally, these BI tools come in several different versions, including browser-based SaaS and desktop and server versions: keeping the features straight among them will require some careful study.
Still, spreadsheets are reaching the end of their utility as work teams spread out across the globe and as we want to build better and more useful data models to run our businesses. At their core, the spreadsheet is really a souped-up calculator, not a way to model and share data. Spreadsheets lose their potency when they grow to beyond a single screen to display your calculations or hold a sparse matrix that doesn’t neatly line up in rows and columns.
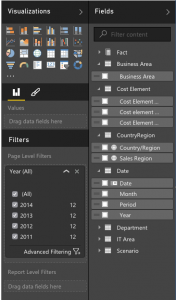
 If you are going to break free of the spreadsheet’s orbit, you probably want to start off with Microsoft’s PowerBI tool (the controls are shown in the screenshot at right). This is free and works both in conjunction and independently from Excel. For a free product, it is amazingly capable. For example, you can query Mailchimp email lists so you can monitor data and trends about your campaigns, reports and individual subscribers, and also query Quickbooks online data. There are both desktop and browser-based versions and a huge collection of learning resources to help you over the hump of getting started.
Besides Microsoft, there are more than several dozen different BI tools: I have looked at a total of ten for PC Magazine, and each has some advantage over a simple spreadsheet. Does this spell the end of the spreadsheet? Hardly. But it does show the beginning of a new market that is worth looking into. As Shaich says in his post, “A spreadsheet is merely a way to organize data. Its numbers generally capture trends of the past, but it is in no way predictive of what’s to come.”
One of my readers suggested this new tool for those that don’t want to give up their spreadsheets but still deal with uncertainty:
https://medium.com/guesstimate-blog/introducing-guesstimate-a-spreadsheet-for-things-that-aren-t-certain-2fa54aa9340#.adsdxl39p
Microsoft’s PowerBI tool looks great. I’ll have to look into it. Thanks for sharing!