The cashless customer is now king

I wanted to bring in my winter coat to the cleaners (maybe optimistically a week or so too soon) and in cleaning out the various pockets I came across some cash and a receipt dated last December. I thought about how long it has been since I have actually used cash.

What a difference from my dad’s world. My dad dealt with millions of dollars every day as a comptroller and always carried a wad of cash worthy of a mafia don. I still have his money clip somewhere. I put the few bills on my desk as a reminder and then thought about how the world has changed. Paying in cash is certainly becoming less common.

Most of my customers still pay me with paper or electronic checks, a few go through Paypal and every once in a while I get asked to accept credit cards. Now there are so many options for accepting Internet payments and two good ones that you might not know about. One is Simplify.com, which is part of MasterCard and has done a lot of work in developing their payment gateway. The other is Stripe.com. Both charge a bit less than 3% per transaction but have no other recurring fees. That is a lot less compared to just a few years ago, when you had to pay monthly processing and other annoying fees to have a merchant account. Stripe even accepts non-dollar currencies, including Bitcoins, and converts them into dollars for you.

aaa2
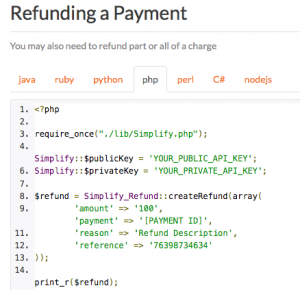
Both Stripe and Simplify offer a variety of APIs, tools, code samples, and connectors to various payment-related apps. I like the way Simplify arranges its code samples, as you can see in this screenshot.

Stripe has more third-party plug-ins than Simplify, including more than a dozen just for WordPress. Both offer documentation on webhooks, which are URLs that can interact with short pieces of code for particular event notifications, although I think Stripe has better documentation. Both also support OAuth for consolidated signons to other SaaS apps without having to store your credentials. Finally, both can operate in either a testing or sandbox mode so you can try various things out, and then go live with actually processing real transactions.

We have come a long way with online payments to be sure. Both services allow you to build in payment processing to your website in ways that were unthinkable just a few years ago. I think my dad would be just as amazed as I am.

Gigaom webinar: Customer-Driven Infrastructure: Building Future-Ready Consumer Applications

Based on a white paper that I wrote earlier in the year for them, I am holding a webinar next week with the above focus. In this webinar David S. Linthicum SVP, Cloud Technology Partners and Brandon Elliott the Chief Technologist for Rackspace and I will examine the infrastructure needs of customer-facing applications by examining the challenges faced by businesses in the most demanding industries. It will provide a framework for evaluating technology decisions from the perspective of customer experience quality and suggest metrics that can help businesses justify and benchmark the success of their investments.

You can register here for the event, to be held on August 28th.


Network World: How Aryaka’s global private network speeds access to Internet apps

arayIf you are trying to improve global access to your applications, you have probably considered one of several solutions: stringing together your own private network, purchasing WAN optimization appliances, or using a managed cloud-based service provider. Figuring out the benefits of each solution isn’t easy and it is hard to test for variations in Internet connectivity, specific applications and other conditions.

But what if a vendor could show you exactly the benefit in a particular use case, so you could understand what they are delivering? I got Aryaka to do just that. You can read my post in Network World today here.

How to Make the Most of your Data: An Explanation of Visualization

This article was written by Jesse Jacobsen, who is a web content writer at TechnologyAdvice. He covers a variety of topics, including business intelligence, project management, and analytics software. Connect with him on Google+.

Most professionals have used bar graphs and Excel pie charts on present data. At its most basic this is what’s known as data visualization, a growing feature of business intelligence software. However, such charts are often too simplistic to convey complex data sets. That’s where today’s advanced data visualization tools come in. With them, it’s easier than ever to manipulate data sets, visualize trends, and find competitive insight. Let’s look at some of the most useful data visualizations, and show how they can provide better insights into your company’s data.

Streamgraph

A streamgraph is a stacked area graph that displays data around a central axis. By assembling the information over a time-based axis, streamgraphs allow users to compare the ebb and flow of different data sets.

1For example, in 2008 the New York Times created an interactive streamgraph that displays the ebb and flow of box office receipts for movies released between 1986 and 2008. It highlights the aesthetic nature of such diagrams, and how they can be used for quickly displaying comparisons.

In addition to being an interesting source for displaying cultural information, streamgraphs can be used to provide business insight. For example, a clothing company sells red, blue, and yellow shirts. By visualizing the daily or weekly sales figures of each shirt, companies can observe how the sales ebb and flow based on the time of day, the day of the week, or even the month. Observations on product popularity can lead to competitive adjustments in inventory ordering, marketing strategy, and even product development.

Treemap

Treemapping is a method for displaying hierarchical data through space-contained, rectangle graphing. This visualization is typically displayed within a larger rectangle, with the surface area divided into segments that correspond to data points.

2Because data in treemaps can be grouped together based on similarities or relevance, this is a great way to visualize categorical data. The Observatory of Economic Complexity did just that in their treemap displaying products exported by The United States in 2009.

By grouping exports into categories like machines, transportation, and vegetable products, this treemap compares diverse data in a way that’s easy to grasp. Companies with a diverse array of products can use treemaps to provide valuable insight into sales data or to evaluate an organization’s budget in a more accessible way.

Geolocating

Geolocation-based visualization modules display data on, you guessed it, a map. While this sounds like a simple concept, different use cases continually demonstrate how this technology can be manipulated to provide business insight.

3Companies commonly use mapping to display store locations or product availability. Many companies include similar mapping capabilities on their websites, which guide customers to the closest store. Many BI vendors take mapping visualization to the next level by including temporal data. This allows users to view geographic trends over time for further insight into behavioral patterns. For instance, Foursquare displayed the “pulse” of New York by calibrating a map to display how commuters use their “check-ins” over the course of a day.

Temporal mapping can also be useful for businesses. If your company is looking to expand to a new city, for instance, temporal mapping (combined with analytics) can provide valuable insight into where the most receptive audience for your product is.

Networks

Network visualization displays the connections of information or systems over time. While network displays can illustrate simple two-way connections, they can also illustrate complex temporal relationships.

4In June, the New York Times created an interactive network visualization that displays how club teams and national teams are connected in the 2014 World Cup. Users can scroll over any information bubble to more clearly see the relationships, including the name of the player that makes the connection.

Network visualization is an effective tool to observe and understand the relational structure of business operations, such as how acquisitions and changes in leadership affected employee retention and division management. Understanding your data through visualization modules can provide you with the information you need to get ahead of the competition.

Stop Web Scraping With ScrapeDefender

Stealing content from websites is all too common but there is a way to protect yourself with a new tool from ScrapeDefender.com. You can track and distinguish scraping bots from normal visitors and monitor your site in near real time too.

We tested their service in February 2014 against several websites, including our own.

http://ScrapeDefender.com

Pricing starts at $79/mo for basic service

How Your Customers Can Collaborate Using Open Xchange App Suite

A flexible unified communications service for collaborative workgroups that can share files, import and export contacts and calendars from a wide variety of data sources and Web services, including Facebook, LinkedIn, Twitter and Google’s Gmail. Entirely open-source based.

Price: Varies depending on market and number of user accounts
Requirements: Works on a wide variety of browsers and operating systems. We tested it in May 2013.

OpenXchange Inc.
2033 Gateway Place
San Jose, CA 95110
408 500 0768
http://ox.io

Speeding up your applications in the Cloud with Blue Coat MACH5

If you are looking to control and improve your cloud-based applications performance, consider Blue Coat’s MACH5 WAN Optimization Appliance. It works any private, public and hybrid cloud deployment.

MACH5 WAN Optimization Appliance
Blue Coat Networks
starting at $2995 for the smallest appliance
http://bluecoat.com/products/mach5

Making Online Video Enterprise Network Friendly


If you are looking to control and improve how your endusers consume video across your network, consider Blue Coat’s MACH5 WAN Optimization Appliance. It works for live, streaming, and on-demand video, and is easy to setup and configure.

MACH5 WAN Optimization Appliance
Blue Coat Networks
starting at $2995 for the smallest appliance
http://bluecoat.com/products/mach5

Getting started with Verizon’s CaaS SMB services

Verizon’s CaaS SMB service is one of many different computing in the cloud providers that anyone can easily set up a variety of Windows and Linux servers in a few minutes. This screencast video was done for Tom’s Hardware and shows how to get started and what some of the choices are in hosting and billing. Note that unlike some other CaaS providers, Verizon will bill you for a server whether it is running or not.

For For further information, go to http://caassmb.verizon.com/