Slashdot: Game Studios at the Forefront of Big Data

If you want to see into the future of BI, then look no further than the nearest gaming development studio. It isn’t all fun and first-person-shooting. The game developers are the sentinels of a variety of advanced IT techniques and are usually out in front of the general IT population in terms of using big data, real time analytics, and cloud computing, among other areas.

We all know that computer games are big business, with last year’s worldwide sales north of $20 billion and even the subcategory of social games at over $2 billion: compare this to around $8 billion for the average annual US movie ticket box office.

We last looked at how Riot Games is using Hadoop and other NoSQL tools to track its players statistics and improve game play in December, but they are just one of many game studios that are taking technology to new heights.

Gamers have been ahead of the curve in three key areas: rapid changes in computing infrastructure, persistent and more personalized data connections from the cloud, and a long history of using graphical processors (GPUs) to support high performance computing. Let’s look at each of these items in more detail, and why the gamers get them.

Rapid on-demand computing changes

“From an infrastructure perspective, games have a high volume of data points due to user interactions and typically have a unique need for fast response. This makes them very tricky cloud data users,” says Robert Nelson, the CEO of Facebook and mobile game developers Broken Bulb Studios. The company makes use of SoftLayer for their cloud hosting and has several terabytes of data with peak transfer rates over 200 Mbps.

“SoftLayer’s platform has a unique combination of scalability and customizability, which supports the dynamic infrastructure of gaming companies. SoftLayer can provision cloud computing instances in minutes, allowing us to rapidly scale up or down as our needs change,” he said. For example, last year as part of a new game launch they saw 1.4 million players come to their website in a week, up from a few thousand beta users prior to the launch. Some of their games have required SoftLayer to double their infrastructure overnight because of heavy demand. This variation in demand is the wheelhouse of cloud computing, but games do seem to have a higher fluctuation than a traditional IT application.

Another gaming studio, Hothead Games, launched its Big Win series of sports games last year. They saw the number of servers rise from six to 60 on the SoftLayer hosting network. It was all handled with ease. “Our code makes hundreds of millions of database transactions a day. It’s critical to our business that every single one of those works reliably and is super fast,” said Joel DeYoung, director of technology at Hothead Games.

SoftLayer isn’t alone in recognizing this market. Peer 1 Hosting has also worked with some of the world’s largest game developers to deliver their games under wide fluctuations in demand. One launch saw traffic spike to more than a thousand servers, which were automatically provisioned by their managed hosting service. And Joyent has supported one of the largest e-learning games called Quizlet with their hosting services. Thanks to some careful analysis, Quizlet found too many PHP calls and was able to rewrite their code to speed up their operations. They have scaled up from a few hundred beta users several years ago to more than 60 million page views a month today.

Persistence and personalization

“Gaming is a more interesting target market than traditional B2C spaces,” says Brian Stone of Causata, a customer experience management company. “And online gaming is even more so, since it offers unparalleled opportunities for cross-selling and upselling. You are competing with your friends and constantly checking your play statistics, and very involved with your social network. Compare that to an online banking app: the game is a lot more engaging and personal.”

Providing the underlying analysis for this personalization means solid BI support, and games use a variety of tools. IsCool Entertainment can analyze more than a million of its online gamers’ activity and social behavior with Actian’s Vectorwise, a Hadoop analytics engine. This provides data for calculating rewards, generates leader boards and delivers virtual prizes, all to enhance customer engagement and retention.

“Games have a persistent connection with the user and as a result, we get so much more data,” said Reid Tatoris, the CEO of PlayThru.com. The company produces games that are used instead of the annoying Captcha Turing tests to verify that a human is signing up for a website. “Interacting with an app doesn’t give you the how. Is this person’s interaction human? How did you go about completing the task? That is where we try to help.” An example of their game is shown below

PlayThru has gotten lots of insights into personal preferences as a result of deploying their app across 20 million page views. “When you are playing a mobile game, you can get all sorts of information about what the user is doing, where they are located, and how they are interacting with the game in near real-time.” Try getting that kind of insight with a user creating a Word document. As a result of PlayThru’s games, they are seeing submission rates increase by 40 percent over the traditional text-based Captcha applications.

One game that is a champion of personalization is the site Fanhood.com, which connects sports fans with their favorite teams through Facebook. “There is so much content to navigate, we try to focus on what is relevant for a particular fan,” says the company’s CEO Brandon Ramsey. “What’s more, we try to structure it within your Facebook social graph so you can immediately tell which of your friends are fans of teams that your local team is playing this week.” Fanhood uses MongoDB and Cassandra to manage millions of rows of data for each team and fan to create its personal team updates.

Having all this data is a tremendous opportunity if managed properly. Causata is handling an online sports betting site, and can provide all sorts of specifics such as who is opening which emails and the path that a customer takes within the site. “We can then predict the number of bets made and their value, the average duration between bets, and the sports that each visitor is most interested in,” says Stone. Causata builds these models using R and Hadoop.

GPU computing

Finally, there is the notion of using graphics processors for boosting general computing tasks. While this concept isn’t new, even here the gaming industry has been ahead of the curve. Several years ago, a group of Swiss researchers put together a cluster of 200 PS3s to form a primitive supercomputer. While Sony disabled this ability soon afterwards, a number of hosting providers now offer on-demand GPU computing in the cloud, making use of Nvidia graphics processors and specialized Linux operating systems that can take advantage of this increased horsepower. The providers include Amazon Web Services, Peer 1 and SoftLayer, among others. This provides more intensive CPU cycles at lower cost too. One of the Amazon configurations was able to place in the top500 list of the most powerful supercomputers for several years running.

All of these BI tools and advanced computing techniques have brought about what Kimberly Chulis, the CEO of Core Analytics, calls “a new focus on advanced analytics and micro-segmentation to drive player monetization. Game developers and brands have an opportunity to apply these big data analytics techniques to capture rich and varied behavioral and multi-structured game and player data.”
ArsTechnica: What lies ahead in the world of networking

Tomorrow’s data center is going to look very different from today’s. Processors, systems, and storage are getting better integrated, more virtualized, and more capable at making use of greater networking and Internet bandwidth. At the heart of these changes are major advances in networking. In my story for ArsTechnica, I examine six specific trends driving the evolution of the next-generation data center and discuss what both IT insiders and end-user departments outside of IT need to do to prepare for these changes.

Need to test your Hadoop app on a thousand nodes? Here’s how.

It isn’t often that you can get access to a thousand-node network to test your latest app, but thanks to the efforts of EMC’s Greenplum unit and some additional computing vendors, you can, and more amazingly, it is free of charge too.

The network was announced last fall at Strata and connects 1,000 specialized servers from Supermicro running dual Intel Xeon processors with 48 GB of RAM apiece along with Mellanox 10 GB Ethernet adapters and switches, and a total of 12,000 Seagate 2 TB drives. It is all contained within Greenplum’s Las Vegas data center, with the goal of having the largest publically accessible Hadoop cluster around. While Yahoo and eBay and others have some fairly large Hadoop clusters, they generally don’t let anyone else come in and try out their apps. The cluster goes under the name of Analytics Workbench. On this page, you can click on the “learn more” button and submit your name if you are interested in using the cluster.

The goal, according to Greenplum staffers, is to have a community and collaborative big data platform that can be applied to a set of analytical problems that have wide appeal. When the Strata announcement was made last fall, Greenplum stated that they wanted to eventually publish any results from the cluster, but they haven’t yet. Intel was one of the first clients to use the workbench (and running a thousand-node job too), but they are still reviewing their results.

Other clients that are running tests on the cluster include Mellanox and VMware, who both donated gear to power it, and a research team from the University of Central Florida. A group from NASA Goddard is using it to perform an analysis of historical weather patterns. The cluster formally opened up in July, and yes, it is really is free of charge. Applicants need to be vetted and work closely with the Greenplum engineers to get their apps uploaded and configured to the cluster.

“We accept bids based on any submitted application and developers can request specific time and resources,” says William Davis, one of the Greenplum product marketers involved with the cluster’s creation. Applications are reviewed by an internal group of Hadoop experts called the Jedi Council, and they try to select who will have the best fit for the next test run on the cluster.

Greenplum intends to use the cluster in a variety of ways besides public testing. Sometime next quarter they will launch a training program for Hadoop. A unique aspect of the program is that each member of the course will be granted access to the cluster to use as a sandbox environment for their own project. They are still working out the details on how this will work. The company has other fee-based programs to leverage its experience with this cluster, including what it calls its Analytics Lab packages. This uses their team of data scientists on specific vertical markets or particular custom applications.

There are several other tools that are offered on the cluster in addition to Hadoop including MapReduce, the parallel job processing software; VMware’s Rubicon system management team; and standard Hadoop add-ons such as Hive, Pig, and Mahout.

Greenplum isn’t the first to have such a large test bed assembled, but probably the first to use this level of gear for Hadoop and other data science activities. In the late 1980s, a group of Novell engineers in Utah created the “SuperLab” which eventually grew to1,700 PCs connected together. The lab was used to prove the features and scalability of Novell’s Netware network operating system, a piece of software that at one time could be found in most enterprises but now is largely a historical curiosity. Just to give you some perspective, in 1999 the PCs in Novell’s lab had a whopping 256 MB of RAM and 8 GB of storage (try buying that on today’s PCs). How times have changed.

Anyway, the SuperLab team left Novell a few years later and built their own private test lab for a startup called Keylabs. I was one of their early customers, using the facility to publish some of the test results in cNet and other IT publications of the first Web server comparison tests.

The Keylabs engineers very quickly discovered that automating the sequencing and actions of the individual PCs was tedious, and they wrote software that eventually spawned Altiris. Part of the assets of this company was later purchased by Symantec and is still used for their desktop imaging and management tool line.

Speaking of scaling up to a thousand machines automatically, running tests on this scale can be tricky. Greenplum has already seen several hardware failures that take down particular nodes as they have begun using their cluster. And like Keylabs, understanding how to sequence all this gear to come online quickly can be vexing: imagine if each machine takes just ten minutes to boot up and launch an app: times ten or twenty nodes that isn’t much of a big deal, but when you are trying to bring up hundreds it could tie up the cluster for the better part of a week in just starting up the tests. “It is a bit of a challenge in educating our customers on how to use and manage something of this size and how to deploy their software across the entire cluster. You can’t deploy software serially, and we have to make sure that our customers understand these issues,” says Davis.

So get your application in now for testing your app. You could be making computing history.

Slashdot: Big Data Meets Big Box: How Two St. Louis Startups are Changing the Retail Game

foodTwo St. Louis startups are working independently to change the way we shop for the basics such as groceries and hardware, with core strategies that rely on Big Data collections to transform the buying process and improve the flow of information from consumers to retailers and brands.

The startups are Aisle411.com and FoodEssentials.com. You can read more about what they are doing on Slashdot/BI here.

Slashdot: For Riot Games, Big Data Is Serious Business

riot games why hadoop

Usually, when we think of firms that are leveraging Big Data analytics and methods, we think of large retailers, stuffy insurance companies and maybe the occasional dot com Internet businesses like Netflix and eBay. Chances are, few of these places explicitly encourage their Hadoop developers to actually play online and video games during the workday

Welcome to Riot Games. You would think that a game development shop would be a more relaxed place, but they have a corporate policy to recruit people who like to play games, and even have a “playfund” where every employee gets an allowance to buy their own games, expense them and more importantly, play them during working hours. “When a big release of a game comes out, our productivity takes a nosedive,” says Barry Livingston, who is the director of engineering for the Big Data group of the company. “We take play seriously, it is an important part of our culture.” Imagine charting your build schedules around the next release of Halo!

Riot created the very successful League of Legends gaming franchise. The game is conducted online, and is free to play. First off, it is widely popular. On a peak day, the game has 3 million concurrent users out of more than 32 million registered players

“We were a scrappy startup and wanted to get our game out the door. Analytics wasn’t an afterthought, but we didn’t have many resources for it initially and so started with one mySQL instance, running queries and downloading them to Excel,” said Livingston. That was fine for the first year or so, but by the summer of 2011 they experienced rapid growth and weren’t prepared for how successful their game was going to be.

Once they opened up a European base of operations, they couldn’t fit all of their data into one instance of mySQL. “So we created a separate instance. That was a bad precedent and we needed to change that. We moved quickly to Hadoop as a scalable low-cost storage system. We use Hive to overlay an SQL-type interface on top of the Hadoop File System.” That helped scale up, but “the downside is that it takes a long time to spin up to do your queries, some taking a minute or more to complete, so it is difficult to iterate and build complex queries using Hive.”

When you think about all the millions of people playing the game in real time, then having to join three massive tables, with player data, game data, and session data – you begin to see how difficult a problem that Riot Games has. This activity generates more than 500 GB of structured data and over four TB of operational logs created every day.

What is interesting is that from humble beginnings, where Riot had a single analyst, they now have an entire BI team of a dozen people and a similar-sized engineering staff, spread between their headquarters office in Los Angeles and a remote office near St. Louis. “We now have tens of people here that can do Hive queries, and we want to enable more access to these kinds of ad hoc discoveries,” Livingston told me. Why St. Louis? Some of the founders grew up there, and they found that there is a lot of talent in the area. “Very big corporations based there, and we have had great luck attracting talented engineers who used to work at Mastercard or Anheuser Busch since our culture is very different. What makes it attractive is that our staff can work on something that millions of people see every day.”

Riot eventually ended up with a combination of tools that work a mix of SQL and Big Data. “We wanted to provide dashboards for our company. We want our people to think about our data when they are making decisions.” These dashboards are built using Tableau. “But it doesn’t interact with Hive very well, such as giving out stats on win rates per champion by game time. We have graphical sliders so you can interact with the data, and every time you move the slider, you get hundreds of different Map Reduce jobs. So we put mySQL in between,” Livingston said. With all this programming, note that the Riot developers have posted 60 different open source Chef and Opscode recipes among other code samples on GitHub.

All this BI work enables them to ask questions such as which game champions (or the higher-scoring players) and skins (character costumes) are popular in which particular geographic regions. Or what are the win rates of champions. “We had lots of unexpected results when we first started doing this analysis. One of the benefits of having all this data is we can be more scientific about it, and we can now check everything,” said Livingston.

They are also working on other tools that can make it easier for anyone to do their own queries and build out reports without having to know MapR and Hive query language. These dashboards aren’t just window dressing, because Riot Games is trying hard to “deeply understand our game and improve the experience for all the players,” Livingston said. “We look at our game as a living, breathing service. We are very player-focused.” Part of their challenge is to maintain a level playing field for all their players, yet constantly tweaking game play and game mechanics to make it more interesting for returning players. “We need lots of insight so that competitive play will continue to happen. We don’t want different versions of the game for pros and noobs for example.”

And when it comes to competitive play, don’t think that we are talking chump change. League of Legends has become perhaps the largest eSports competition around, according to game analysts at Forbes and others. Earlier this year, professional players competed for a three million dollar purse.

As a result, League of Legends popularity is increasing, and that means that the engineers have to plan for increasing their computing capacity far ahead of when they will actually need it. “It is very difficult to do. There is no easy way to do it. I like to try to think that far ahead, at least have some kind of plan for the next quarter. I know our needs are going to change. We try to guess and do a lot of ‘what ifs’ and give us some lead time for hardware purchases.”

If you are looking for more specifics on how Riot Games uses Hadoop and more of the technical choices they made, view their slide deck here. They told me they are hiring in both locations, provided you can get ready for some serious fun and games.

Slashdot: The Brave New World of Crowdsourcing Maps

In our story last month, we covered various crowdsourced community methods, looking at the combination of Kaggle contests and Greenplum analytics. There are other examples besides this collaboration where communities are leveraging their own people and data, and some of the most illustrative quite literally are what people are doing to build their own specialized maps.

A map is a powerful data visualization tool: at one glance, you can see trends, clusters of activities and track events. Edward Tufte, data visualization expert, explains how one doctor’s mapping of a Cholera outbreak in 1850’s London was able to track the cause of the epidemic – a bacterium that was transmitted through infected water – to a particular street corner water pump. The good doctor didn’t use Hadoop but shoe leather to figure out where people who were getting sick were getting their water supply. And what is interesting is that this is long before the actual bacterium was discovered in the 1880s.

Enough of the history lesson. Let’s see how crowdmapping and big data science are bringing new ways to visualize data in a more meaningful context.

As one example, last month I was visiting our nation’s capital and noticed that on many streets were racks of bicycles ready to be rented for a few dollars a day. These bikesharing programs are becoming popular in many cities – New York is set to roll its one out sometime soon. The DC program has been in place for about a year, with more than 1600 bikes spread across the city in 175 different locations. Now the operation, called Capital Bikeshare, wants to expand across the Potomac River into the Arlington, Virginia suburbs. So they decided to crowdsource where to put these new locations, and set up this site here to collect the suggestions. On the map you can see locations that the community has suggested and where county planners have recommended, along with of course the locations of the existing stations. You can also leave comments on others’ suggested locations. It is a great idea and one that wouldn’t have been possible just a few years ago, when these mapping tools were expensive or finicky to code up.

Some other successful crowdmaps can be found in some unusual locations. While we traditionally think that you need a lot of computing power and modern data collection methods, crowdmapping is also happening in places where there is little continuous electricity, let alone Internet access, in many places in the third world.

For example, outside of Nairobi Kenya a neighborhood called Kibera was a blank spot on most online maps until a few years ago. Then a bunch of residents decided to map their own community, using online open source mapping tools. It has grown into a complete interactive community project, and as you can see from the map below important locations such as running water and clinics are shown on the map quite accurately.

In another third-world crowdmap is one that is just as essential as the Kibera project. This effort, called Women Under Siege, has been documenting the history of sexual violence attacks in Syria. The site’s creators state on their home page, “We are relying on you to help us discover whether rape and sexual assault are widespread–such evidence can be used to aid the international community in grasping the urgency of what is happening in Syria, and can provide the base for potential future prosecutions. Our goal is to make these atrocities visible, and to gather evidence so that one day justice may be served.” You can filter the reports by the type of attack or neighborhood, and also add your own report to the map.

One of the first community mapping efforts was started by Adrian Holovaty in 2007 in Chicago, mapping city crime reports to the local police precincts. Since then the Everyblock.com site has been purchased by MSNBC and expanded to 18 other cities around the US, including Seattle, DC, and Miami. “Our goal is to help you be a better neighbor, by giving you frequently updated neighborhood news, plus tools to have meaningful conversations with neighbors,” the site’s About page states. You can set up a custom page with your particular neighborhood and get email alerts when crime reports and other hyperlocal news items are posted to the site. The site now pulls together a variety of information besides crime reports, including building permits, restaurant inspections, and local Flickr photos too. This shows the power of the map interface, making this kind of information come alive and meaningful to those who live near these events.

Another effort is called SeeClickFix, which has mobile apps that you can download to your smartphone where citizens who see a problem can report it to their local government and provide detailed information. It was most recently used by various communities that were hard hit by Superstorm Sandy in October, such as this collection of issues from Middletown Conn. area as seen below:

Google put together its own Sandy Crisis Map and displays open gas stations and other data points on it to help storm victims find shelter or resources.

Communities are what you define them, and not always from people living near each other but who share common interests. Our next map is from California’s Napa Valley, home to 900 or so wineries in a few miles juxtaposition. David Smith put this map together that shows you each winery and when they are open, whether appointments are required for tastings, and other information. Once he got this project started, Barry Rowlingson added on to it using R to help with the statistics. What makes this fascinating is this is just a couple of guys who are using open source APIs to build their maps and make it easier to navigate around Napa’s wineries.

Here is another great idea for mapping very perishable data. There are several cities that have implemented real-time transit maps that show you how long you have to wait for your next bus or streetcar. There are dozens of transit systems that are part of NextBus’s website, which mostly focuses on US-based locations. But there are plenty of others: Toronto’s map can be found here, and Helsinki’s transit map can be found here. You can mouse-over the icons on the map to get more details about the particular vehicle. The best thing about these sorts of sites are that they are very simple to use and encourage people to take transit, since they can see quite readily when their next bus or tram will arrive at their stop.

If I have stimulated your mapping appetite, know that there are lots of other crowdmap sites, including Crowdmap.com, ushahidi.com and
Openstreetmap.org, along with efforts from Google. They are all worthy projects, and combine a variety of geo-locating tools with wiki-style commenting features and interfaces to attach programs to extend their utility.

If you want learn more, here is a Web-based tutorial offered by Google’s Mapmaker blog that will show you the simple steps involved in creating your own crowd map and how to find the data to begin your explorations. Here is a similar tutorial for CrowdMap. Good luck with finding your own map to some interesting data relationships.

Welcome to the omnichannel

One of the biggest problems for ecommerce has always been what happens when customers want to mix your online and brick and mortar storefronts. What if a customer buys an item online but wants to return it to a physical store? Or wants an item that they see online but isn’t in stock in their nearest store?
This isn’t a new issue. I remember teaching ecommerce intro classes at various Interops around the world back in 1998 and having to address the problem then. In one of my classes, we had the developers from the US Postal Service that were trying to figure out how they could manage their stamp inventories and not end up selling stamps that they no longer had in stock.

But today it is become more of an issue, especially as the growth in online sales continues to rise. And while supply chain management gets a lot of attention, what should drive a company is how demand for its products are tracked.

I spent some time this week at the Teradata Partner User conference and got to hear first-hand from Wade Latham, the Director of Business Process at Macy’s. Macy’s has three physical store chains totaling 800 stores and two online business units. They have operated independently but recently have begun to manage their demand chains more carefully.

Latham said, “We wanted our customers to buy anywhere and be able to fulfill the order from anywhere.” The problem was that their original processes were mostly manual or used Excel spreadsheets to track demands. “We couldn’t recognize seasonal or climate differences among our stores, and couldn’t really accurately forecast inventory levels. We also wanted to collaborate and share information both internally with our merchants and externally with our vendors for better planning, so they would have the product to ship us when we need it.”

The problem for Macy’s is that they buy stuff six to nine months before any of the items are on their shelves. But they wanted to start forecasting their demands when they made the purchase, so they could plan in advance. One of their biggest decisions is when to buy two of something. You would think that a chain of department stores would be purchasing things in greater lots than two, but because they sell about a tenth of each SKU each week, this can be an issue. Some of their departments sell things faster than others, and some stores – such as their flagship store on Herald Square in Manhattan – sell a lot of stuff even faster still.

The goal of demand chain management is bottom-up forecasting. You collect a lot of assumptions and dial in things such as the type of ethnic population that visits your store: having more Asian-American shoppers means you will sell more smaller sized merchandize, which makes sense.

Macy’s switched to Aprimo’s Demand Chain Management software, and used several of its retail-specific modules for intelligent stock item introduction monitoring and to track clusters of item profiles. “We focused on the opportunities surrounding replenishment of our stock, because they have higher profit margins,” he said. “Now we account for seasonality and can rank our stock items by location and know exactly what inventory we have on hand.” About 40% of Macy’s stock has been entered into the new system, which took about 18 months to build from start to finish. Latham says Macy’s is seeing a seven percent sales increase and more frequent inventory turns as a result, and a lot more satisfied customer base too.

All this means that the omnichannel is here to stay, especially for retailers who are trying to manage multiple demand chains.

Slashdot: Coping with Too Much Data: How Boeing, Nike and Others Did It

Businesses wring their hands over having too little data. But what happens when you have too much of the same data? Figuring out conflicting reports, deciding between different metrics, and removing duplicate entries can prove an enormous drain of time and resources—especially for some of the world’s largest companies, which have implemented too many data warehouses, or data marts, that tell different stories about the same business processes or events.

Every executive wants workers to run reports that present accurate and consistent information—no matter what the data’s origin. At this month’s Teradata User Conference in DC, I heard from a number of IT architects on how they handled the situation and got their data more “truthy,” as Colbert might say.

Here is my full report about how some companies have coped from Slashdot.

Slashdot: Segregate your data owners by personae


Positing particular personae (say that slowly) isn’t something new when it comes to website design: The FutureNow guys have been doing it for more than five years, and there are a number of other content engagement “experts” that have their own ways at better segmenting and understanding your ultimate audience. The process of using particular personae can be a way to develop websites that can deliver higher click-through rates and improved customer experience. All well and good, but what about improving the internal data access experience too?

That was the subject of a session at the Teradata Users Conference in Washington DC in October. I heard about how you can use personae to segregate and better target your data owners and data users. It is an intriguing concept, and one worth more exploration.

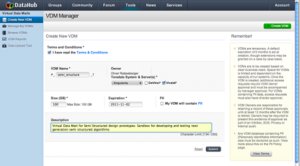
(An example of virtual data marts at eBay, more explanation below.)

slash

The session was led by Gayatri Patel, who works in the Analytics Platform Delivery team at eBay and has been around the tech industry for many years. There aren’t too many places that have as much data as eBay has: each day they create 50 TB’s worth and they have more than 100 PB per day that is streamed back and forth from their servers. That is a lot of collectibles being traded at any given point. And something that I didn’t really understand before: eBay is a lot more than a marketplace. They have developed a large collection of their own mobile apps that are specific for buying cars, or fashion items, or concert tickets for their specific audiences. In the past they have had difficulties in trusting their data, because two different metrics would come up with different numbers for the same process, so that often meetings would be consumed with different groups presenting conflicting views on what was actually going on across their network.

Patel has come up with mechanisms to focus her team’s energies on particular use cases to better understand how they consume data, and to supply her end users with the right tools for their particular jobs. To get there, she has worked hard to develop a data-driven culture at eBay, to identify the data decision-makers and how to help them become more productive with the right kinds of data delivered at the right time to the right person.

Let’s look at how she partitions her company of data heavyweights:

  1. First are the business executives who are looking at top-line health and metrics of their particular units and have relatively simple needs. They want to drill down deeper to particular areas or create operational metrics and get more narrow and focused areas of particular data sets. Let’s say they want to see how weather-caused shipping delays from sellers are impacting their business. These folks need dashboards and portals that are one-stop shops where you can see everything at a glance, post your comments and share your thoughts quickly with your business unit team. Patel and her group created personal pages with a “DataHub” portal called Harmony, that makes sure all of their metrics are current and correct, and where the executives can bookmark particular graphs and share them with others.
  1. Second are product managers who are looking to learn more about their customers, and want to do more modeling and find the right algorithms to improve their marketplace experience. “We followed some of our managers around, attended their meetings and tried to understand how they use and don’t use data,” Patel said. Her team came up with what they call the “happy path” or what others have called the “golden path” – the walk that someone takes during their daily job to find the particular dataset and report that will help them do their job and make the best decisions. “Each product team has a slightly different path in how they interact with their data,” she said. “Our search development teams are more technical and data-savvy than the teams who work on eBay Motors, for example.” Her team has to constantly refine their algorithms to make the happy paths more evident and useful and well, happier for this group of users.
  1. Third are data researchers and data scientists. These folks want to go deep and understand how everything fits together, and are looking to make new discoveries about particular eBay data patterns. They want more analysis and are constantly creating ad hoc reports. Patel wanted to make this group more self-sufficient so they can concentrate on finding these new data relationships. Her team created better testing strategies, what she called “Test and Learn,” which has a collection of short behavioral tests that can be quickly deployed, as well as more longitudinal tests that can take place over the many days or weeks of a particular auction item on eBay. “We want to fail fast and early,” she said, which is in vogue now but still is something to consider when building the right data access programs. Patel and her team have developed a centralized testing platform to make it easier to track company-wide testing activities and implement best practices.
  1. Next is your product and engineering teams. They do prototypes of new services and want to measure their results. These teams are creating their own analytics and constantly changing their metrics using methods that aren’t yet in production. For this group, Patel made it easier for anyone to create a “virtual data mart” which can be setup within a few minutes, so that each engineer can build their own apps and create specific views pertinent to their own needs. (A sample screen is shown above.)

eBay has three different enterprise data efforts to help support all of these different kinds of data users. They have a traditional data warehouse on Teradata, three of them in fact. They have a fourth warehouse which is semi-structured and called “singularity” that has more behavioral data for example. Finally, they use Hadoop for unstructured Java and C programs to access. The sizes of these things is staggering: Each of the traditional data warehouses is 8 TB and the other two are 42 and 50 PB respectively.

As you can see, the eBay data landscape is a rich and complex one with a lot of different moving parts and specific large-scale implementations that meet a wide variety of needs. I liked the way that Patel is viewing her data universe, and having these different personae is a great way to set her team’s focus on what kinds of data products they need to deliver for each particular group of users. You may want to try her exercise and see if it works for you, too.

How Liberty Mutual built their first mobile app with Mendix

One of the largest insurers in the US was looking to roll out a new mobile app for its group insurance customers. Chris Woodman, an IT manager at the firm, described at Mendix World the process they went through and how Mendix was a key element to their success.

“In 2011, we wanted to develop a mobile app, but we didn’t know what we were getting into, and we had no previous mobile development experience,” he said. “Two months later we had our app deployed.” Mendix awarded the project as the outstanding effort of the year at the conference.

You can read more of my report on Liberty Mutual’s efforts from the Mendix blog here.

There are other entries that I authored during the show, and here are their links. Mendix definitely has an interesting story to tell. Here are the original stories that I filed and since then taken off their blog.

  • How fast can you deploy your apps?
  • John Rymer from Forrester describes his favorite mobile apps
  • Wrap of the first day at the confrence
  • Ron Tolido of Cap Gemini Europe spoke about whether your company has a business prevention department
  • The student programming competition
  • Wrap of the second day of the conference